What is Technical Analysis in the Stock Market?
Technical analysis for beginners in India can seem complex at first, with charts, indicators, and patterns. But in reality, it is a simple and powerful way to understand how markets move and how traders make decisions.
When people first enter the world of markets, one of the most common terms they come across is Technical Analysis. It often sounds complex, filled with charts, indicators, and patterns. But at its core, technical analysis is much simpler than it appears.
Technical Analysis is the study of price movements using charts to understand market behavior and identify potential trends.
Instead of focusing on a company’s financials or news, technical analysis looks at one primary factor — price. The idea is that everything known about an asset is already reflected in its price, and by studying how price behaves over time, we can gain insights into market sentiment.
Understanding the Core Idea
At its foundation, technical analysis is built on three key principles:
1. Price Discounts Everything
This means that all available information — news, earnings, global events — is already reflected in the price. Instead of reacting to news, technical analysis focuses on how price responds.
2. Price Moves in Trends
Markets do not move randomly all the time. They tend to move in trends — upward, downward, or sideways. Identifying these trends early is one of the main objectives of technical analysis.
3. History Tends to Repeat Itself
Human behavior in markets tends to be consistent. Patterns that formed in the past often appear again because market participants react in similar ways under similar conditions.
Why Technical Analysis Matters
Markets are driven by people — their expectations, fears, and decisions. Technical analysis helps translate that behavior into something visible.
Instead of guessing, it allows you to:
-
Observe how price reacts at certain levels
-
Identify areas where buyers or sellers are active
-
Understand whether a trend is strong or weakening
It does not predict the future with certainty, but it provides a structured way to interpret what is happening.
The Role of Charts
Charts are the primary tool in technical analysis. They visually represent how price has moved over time.
The most commonly used chart is the candlestick chart, which shows:
-
Opening price
-
Closing price
-
Highest price
-
Lowest price
Each candlestick reflects a small story of market activity — whether buyers were stronger or sellers dominated during that period.
Over time, these candles form patterns that can offer insights into market direction.
Key Concepts in Technical Analysis
To begin understanding technical analysis, there are a few essential concepts to focus on:
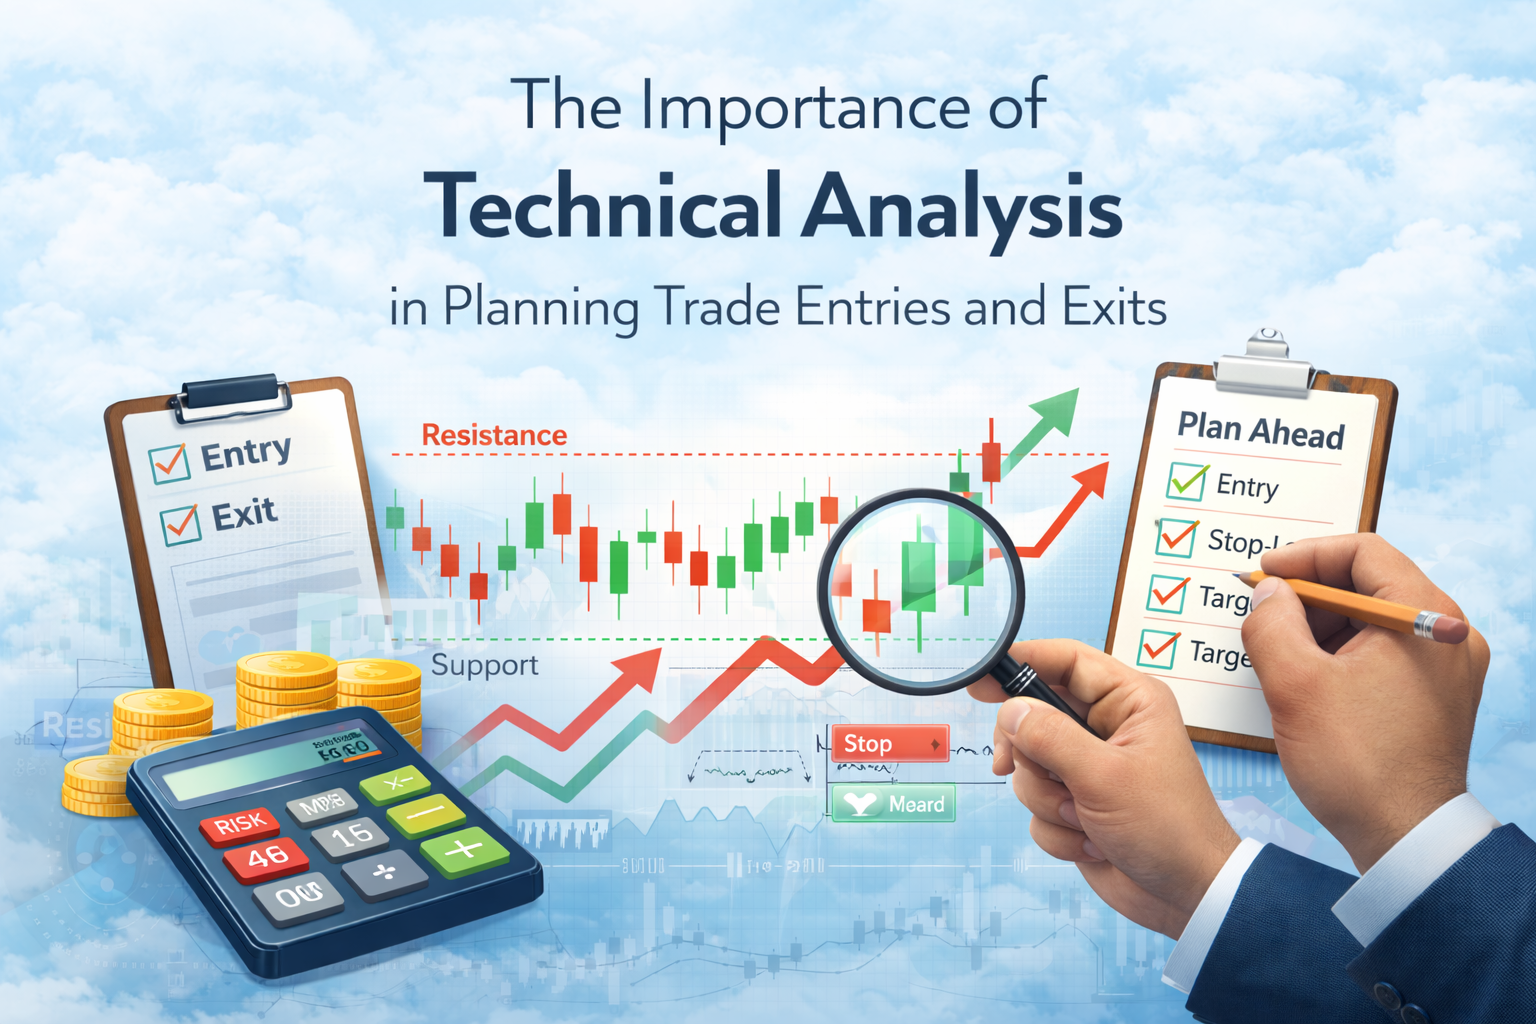
1. Support and Resistance
Support is a level where price tends to stop falling and may bounce upward.
Resistance is a level where price struggles to move higher and may reverse downward.
These levels are important because they represent areas of strong buying or selling interest.
2. Trends
A trend shows the overall direction of the market.
-
Uptrend → Higher highs and higher lows
-
Downtrend → Lower highs and lower lows
-
Sideways → No clear direction
Recognizing the trend helps in understanding the broader context of price movement.
3. Volume
Volume represents the number of trades happening in the market.
Higher volume often confirms strength in a move, while low volume may indicate uncertainty or lack of participation.
4. Indicators
Indicators are tools derived from price data that help provide additional insights.
Some commonly used indicators include:
While useful, indicators should support your understanding — not replace it.
Technical Analysis Across Asset Classes
One of the strengths of technical analysis is that it works across different markets.
Whether it is:
-
Stocks
-
Commodities
-
Forex
-
Indices
The principles remain the same because all markets are driven by supply and demand.
This makes technical analysis a versatile skill that can be applied broadly.
Common Misconceptions
There are a few misunderstandings around technical analysis that are worth addressing:
“Technical Analysis Predicts the Future”
It doesn’t. It helps in understanding probabilities and possible scenarios.
“More Indicators Mean Better Analysis”
In reality, too many indicators often create confusion. Simplicity is usually more effective.
“It Works Every Time”
No method works all the time. Technical analysis is about consistency over time, not perfection.
The Right Approach
Technical analysis is not about finding perfect signals. It is about developing a way to observe and interpret price behavior.
A good approach involves:
-
Keeping charts clean and simple
-
Focusing on key levels
-
Being patient and disciplined
-
Continuously learning from past observations
Over time, patterns become clearer, and decision-making becomes more structured.
Final Thoughts
Technical Analysis is not a shortcut or a magic tool. It is a skill — one that improves with practice and observation.
At its best, it helps you:
If you’re starting out, take it step by step. Focus on the basics, observe charts regularly, and avoid the urge to complicate things too quickly.
Markets reward clarity, patience, and discipline — and technical analysis, when approached correctly, can help you move in that direction.
This content is for educational purposes only and does not constitute investment advice.


Post Comment