(A Practical Guide Using Global Market Trends & Data)
In financial markets, ideas are everywhere — news, opinions, predictions, and endless analysis. But the real challenge is not generating ideas… it is converting those ideas into structured decisions.
This is where Technical Analysis becomes powerful.
Whether you are tracking the US markets, European indices, or Asian trends, technical analysis provides a universal framework to move from thinking → to executing.
In this guide, we will explore how you can use basic technical analysis to transform ideas into actionable insights, supported by global market trends, case studies, and key data points.
Why Technical Analysis Works in Global Markets
Global markets may differ in geography, but price behavior remains consistent.
Whether it’s:
All follow the same principles:
-
Trends
-
Support & Resistance
-
Momentum cycles
This makes technical analysis globally applicable and scalable.
From Idea to Execution: The Core Process
Most traders fail not because of lack of ideas, but because of lack of structure.
Here’s a simple transformation model:
Idea → Validation → Structure → Execution
Step 1: Idea (Market Observation)
Example:
This idea could be based on:
-
News
-
Earnings growth
-
Sector performance
Step 2: Validation Using Charts
Instead of blindly acting, use technical analysis to validate:
Look for:
Step 3: Structure the Trade
Define:
-
Entry level
-
Stop-loss
-
Target zone
Step 4: Execute with Discipline
Follow the plan instead of reacting emotionally.
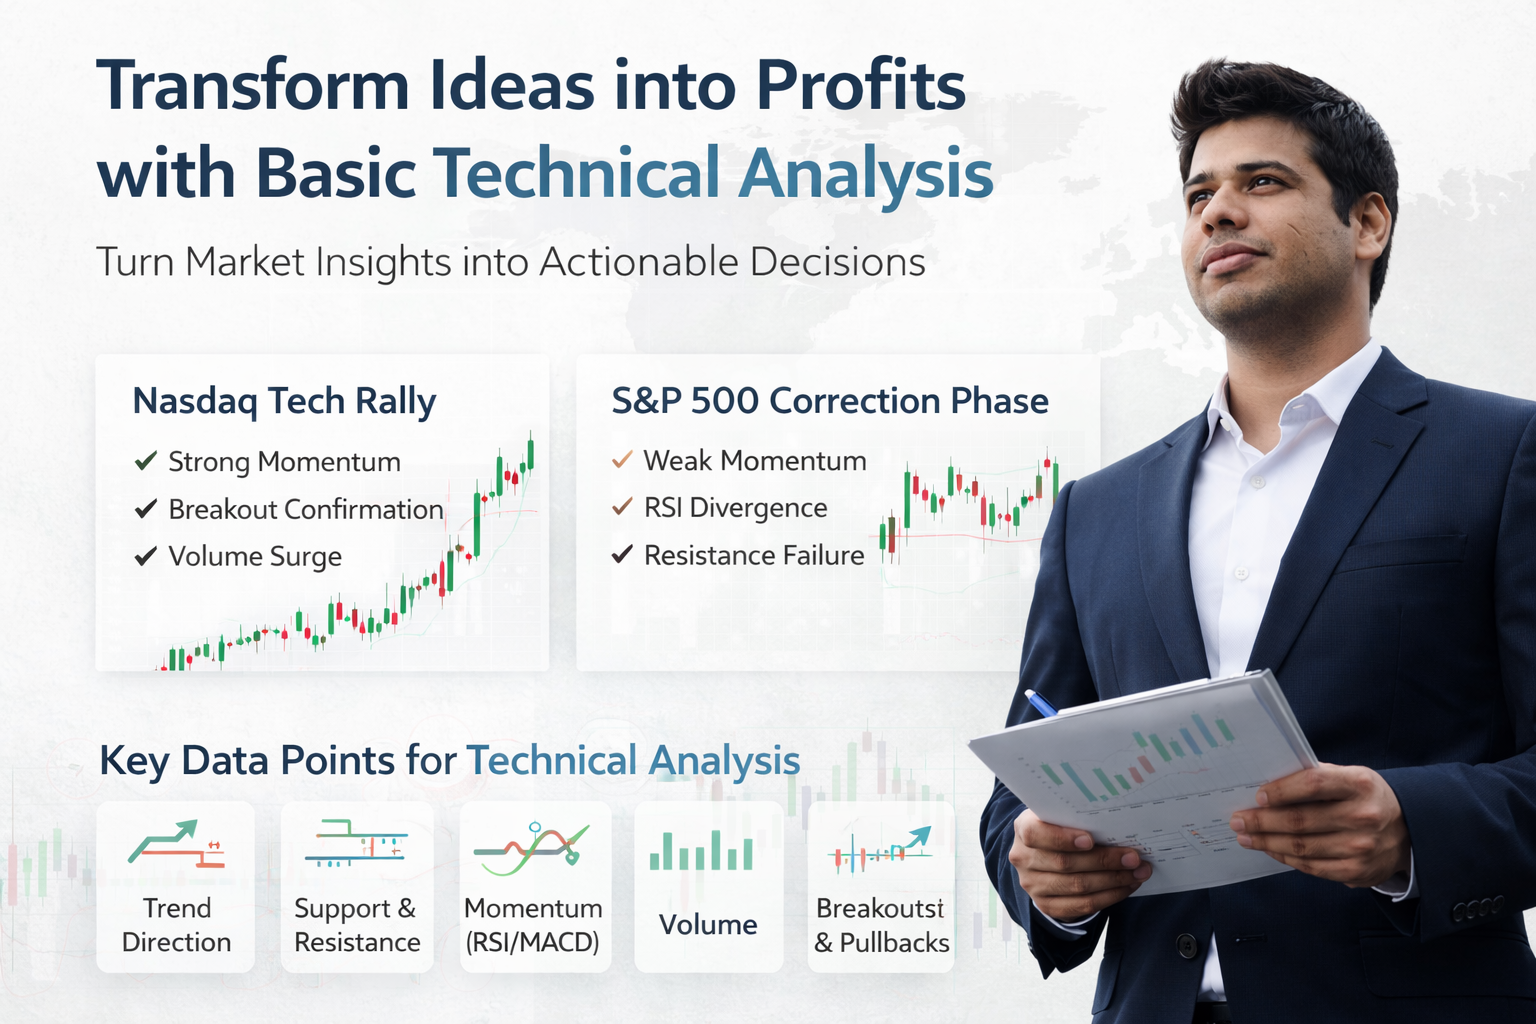
5 Key Technical Data Points for Global Markets
To simplify technical analysis, focus on these 5 powerful data points:
1. Trend Direction (Primary Signal)
Always start with the trend.
Example (Global Insight):
What to check:
Trend defines your bias.
2. Support & Resistance Zones
Markets respect key levels across all regions.
Example:
Use cases:
-
Entry near support
-
Exit near resistance
These zones act as decision points.
3. Momentum Indicators (RSI / MACD)
Momentum confirms strength.
Example:
Momentum helps avoid weak setups.
4. Volume Confirmation
Volume validates price movement.
Example:
Strong volume = strong conviction.
5. Market Structure (Breakouts & Pullbacks)
Understanding structure helps in timing.
Example:
This pattern is visible across global indices.
Real Global Case Studies
Case Study 1: Nasdaq Tech Rally
Observation:
Tech stocks showed strong momentum post earnings cycles.
Technical Confirmation:
Result:
Lesson:
Momentum + breakout = high probability setup
Case Study 2: S&P 500 Correction Phase
Observation:
Market showed signs of exhaustion.
Technical Signals:
Result:
Lesson:
Weak momentum often precedes pullbacks
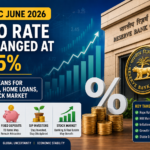
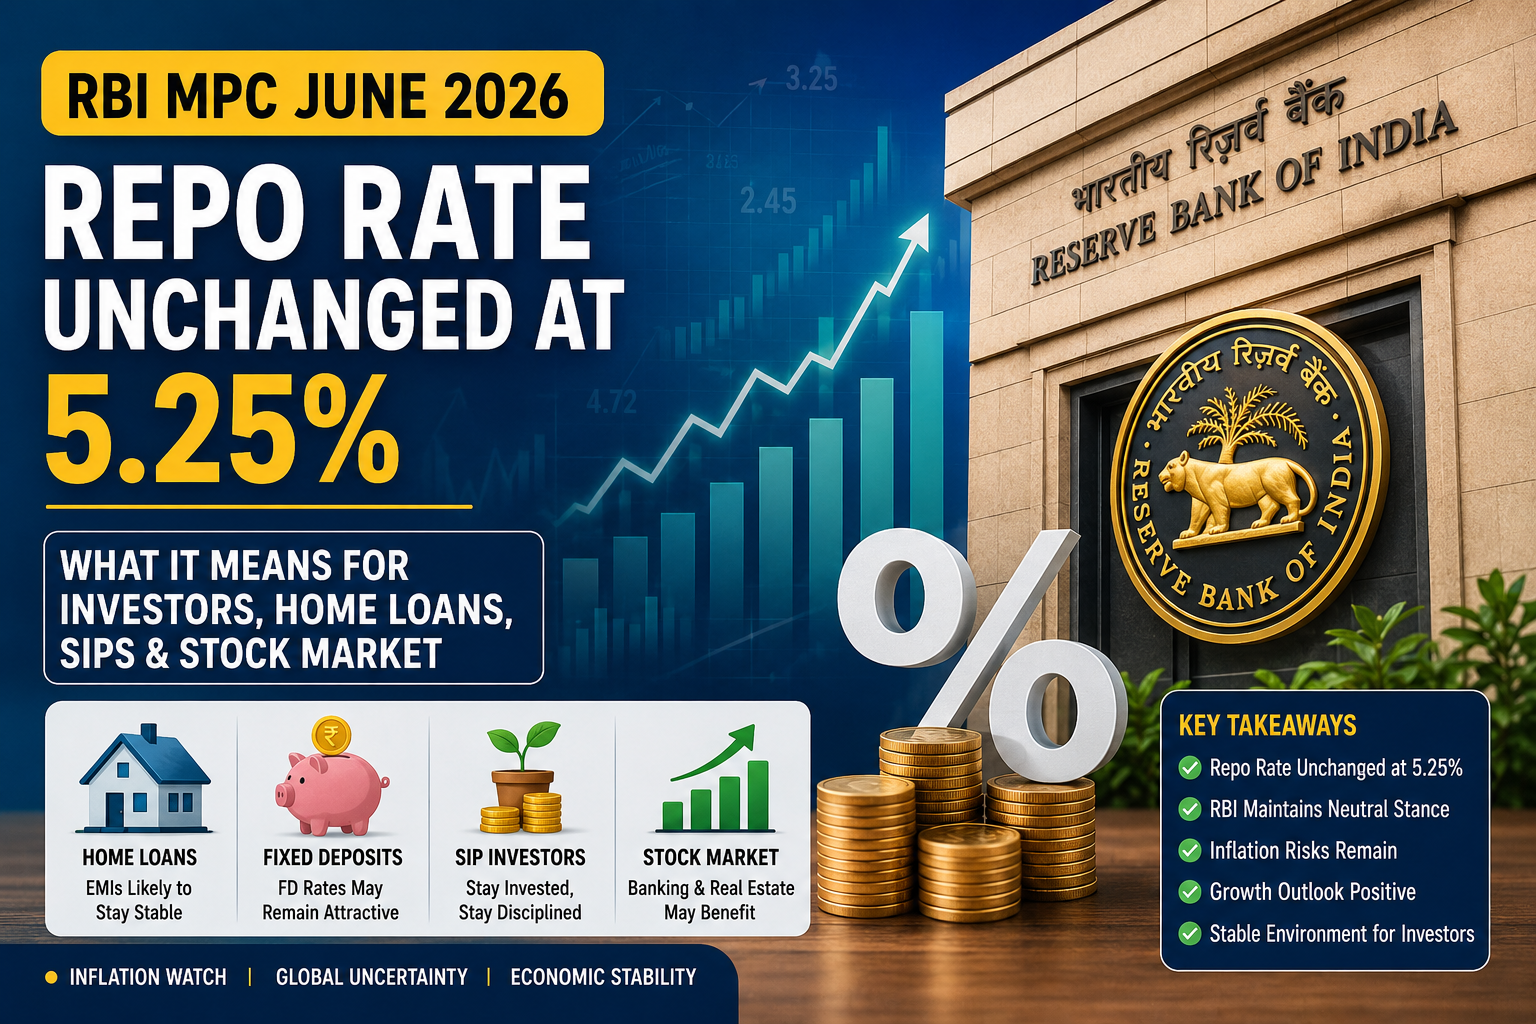
Case Study 3: Global Market Reaction to Interest Rates
Observation:
Central bank announcements impacted global indices.
Technical Behavior:
-
Increased volatility
-
Fake breakouts
-
Range-bound movement
Lesson:
Macro events affect structure, not just sentiment
Trending Concepts in Global Technical Analysis
To stay relevant, focus on these modern trends:
Multi-Timeframe Analysis
Analyzing both short-term and long-term charts for clarity
Smart Money Concepts (SMC)
Tracking institutional behavior through price structure
Algorithmic Trading Influence
Understanding how automated systems impact price movement
Intermarket Analysis
Studying relationships between:
-
Stocks
-
Commodities
-
Bonds
-
Currencies
Common Mistakes in Global Market Trading
Ignoring Global Context
Markets are interconnected — don’t analyze in isolation.
Overtrading Based on News
News creates ideas, but charts confirm decisions.
Lack of Risk Management
Even global trends can reverse — always define risk.
Practical Strategy for Beginners
If you want a simple approach:
Step 1: Track Major Indices Daily
Step 2: Identify Trend
Use moving averages or price structure.
Step 3: Mark Key Levels
Support and resistance zones.
Step 4: Wait for Confirmation
Breakout or pullback.
Step 5: Execute with Plan
Entry + Stop-loss + Target.
Final Thoughts
Transforming ideas into profits is not about predicting markets — it is about structuring your approach.
Technical analysis provides that structure.
By focusing on:
-
Trends
-
Key levels
-
Momentum
-
Volume
-
Market structure
you can move from:
Global markets may seem complex, but with a clear framework, they become easier to understand.
Start simple. Stay consistent. Keep observing.
Over time, your ability to interpret and act will improve — and that’s where real growth happens.


Post Comment