An Incredibly Easy Fundamental Strategy for Everybody

(A Practical Guide to Fundamental Analysis of a Stock)
When people hear the term Fundamental Analysis of a Stock, it often feels complicated — filled with balance sheets, ratios, and financial jargon.
But in reality, it doesn’t have to be overwhelming.
You don’t need to analyze hundreds of data points to understand a company. In fact, focusing on a few key fundamentals can give you a very strong understanding of any business.
In this guide, we simplify everything into an easy-to-follow fundamental strategy based on 7 powerful data points that anyone can use.
Why Fundamental Analysis Matters
Before jumping into numbers, let’s understand the purpose.
Fundamental analysis helps you answer one simple question:
Is this business worth understanding and tracking over time?
It shifts your focus from:
-
Price → to Value
-
Noise → to Structure
-
Short-term → to Long-term clarity
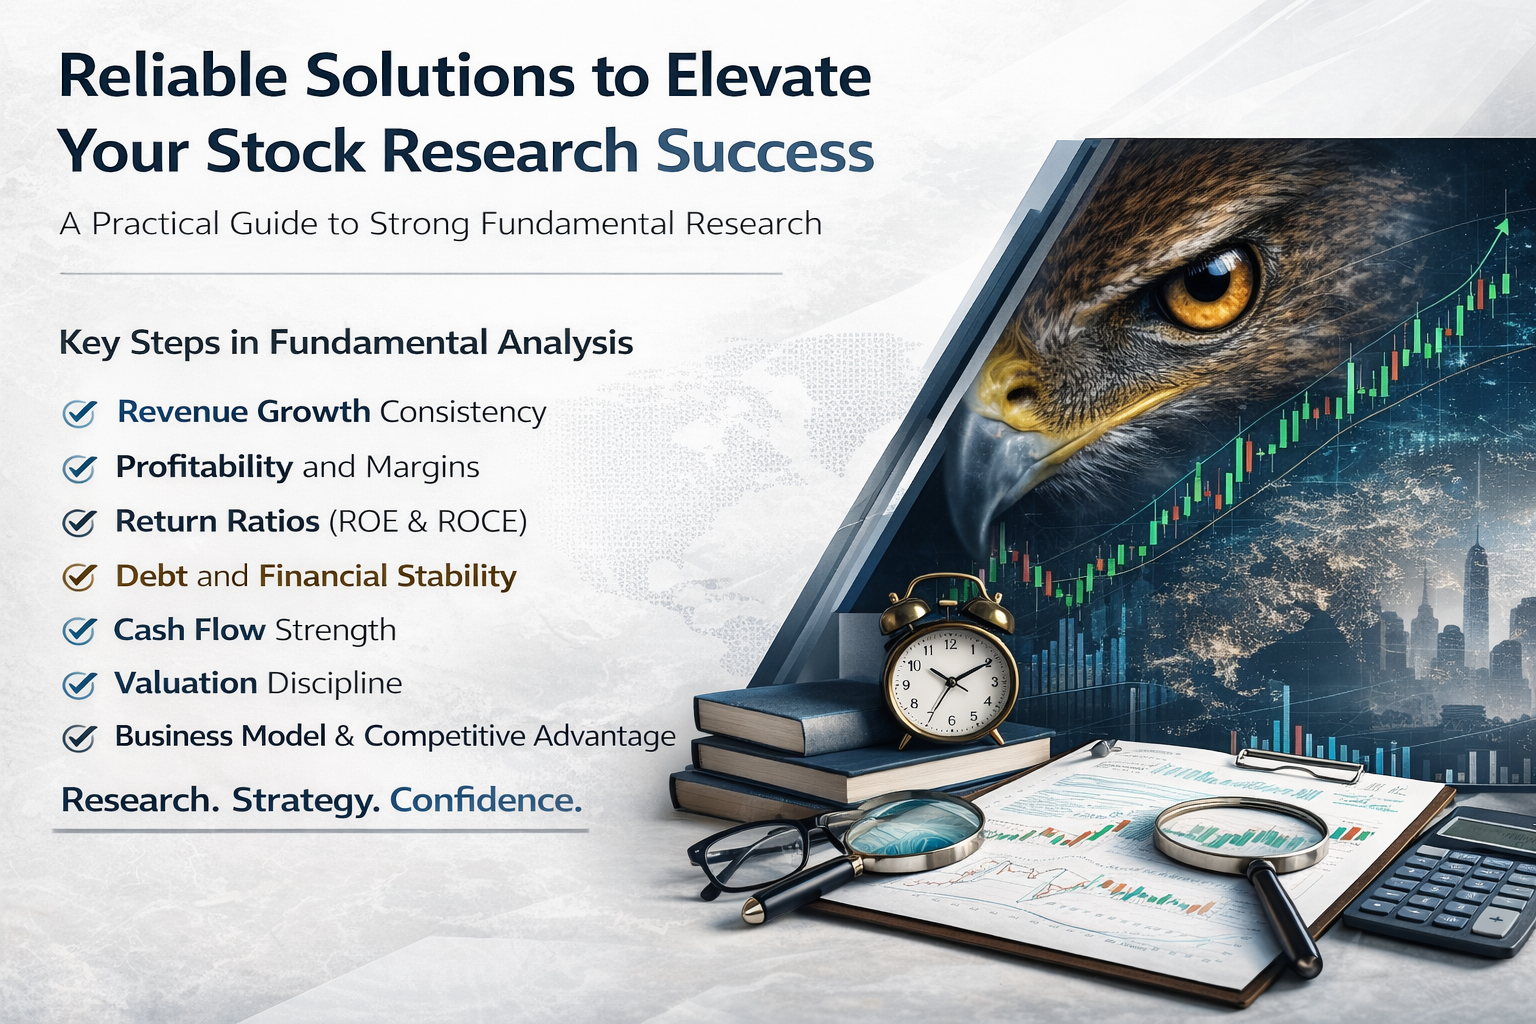
The Simple 7-Point Fundamental Strategy
Instead of getting lost in complexity, focus on these 7 essential data points for effective fundamental analysis of a stock.
1. Revenue Growth — Is the Business Expanding?
Revenue tells you how much money a company is generating.
What to look for:
-
Consistent growth over 3–5 years
-
Stable or increasing trend
Why it matters:
-
Growth in revenue shows demand
-
It reflects the company’s ability to scale
A company without revenue growth struggles to sustain long-term performance.
2. Profitability — Is the Company Actually Making Money?
Revenue alone is not enough. Profitability shows efficiency.
Key metrics:
-
Net Profit
-
Operating Margin
What to check:
-
Is profit growing along with revenue?
-
Are margins stable or improving?
A strong business converts revenue into profit consistently.
3. Return on Equity (ROE) — Efficiency of Capital
ROE tells you how effectively a company uses shareholders’ money.
Formula (conceptually):
-
Profit relative to equity
What is good?
-
Generally above 12–15% (depends on industry)
Why it matters:
-
High ROE indicates efficient management
-
Low ROE may signal poor capital utilization
4. Debt Levels — Financial Stability
Debt can either support growth or create risk.
Key metric:
-
Debt-to-Equity Ratio
What to observe:
-
Low or manageable debt levels
-
Ability to service debt
Too much debt increases financial risk, especially during downturns.
5. Cash Flow — Real Money Matters
Profit can sometimes be adjusted, but cash flow is harder to manipulate.
Focus on:
-
Operating Cash Flow
What to check:
-
Is the company generating positive cash flow?
-
Is it consistent over time?
Strong cash flow indicates real business strength.
6. Valuation — Are You Paying the Right Price?
Even a great company can be a poor investment if it’s overpriced.
Key metric:
-
P/E Ratio (Price to Earnings)
What to consider:
-
Compare with industry average
-
Avoid extremely high valuations without strong growth
Valuation connects business quality with market price.
7. Business Model & Industry Position
Numbers alone don’t tell the full story.
Ask:
-
What does the company do?
-
Is the business scalable?
-
Does it have a competitive advantage?
Examples of strong traits:
-
Strong brand
-
Market leadership
-
Entry barriers
A good business survives — a great business dominates.
How to Use This Strategy Practically
Now that you know the 7 key data points, here’s how to apply them:
Step 1: Quick Screening
Check revenue, profit, and debt to filter weak companies.
Step 2: Deeper Understanding
Analyze ROE, cash flow, and valuation.
Step 3: Business Context
Understand the industry and long-term potential.
Step 4: Build Perspective
Avoid rushing — observe trends over time.
Common Mistakes to Avoid
❌ Overanalyzing Too Many Metrics
Stick to the core data points — clarity is key.
❌ Ignoring Consistency
One good year doesn’t define a strong business.
❌ Focusing Only on Price
Fundamental analysis is about value, not short-term price moves.
❌ Comparing Across Different Industries
Always compare companies within the same sector.
Why This Strategy Works
This approach is effective because it focuses on:
-
Simplicity
-
Consistency
-
Practical understanding
Instead of trying to predict markets, you focus on:
-
Understanding businesses
-
Observing performance
-
Building long-term clarity
Fundamental Analysis + Patience
Fundamental analysis is not about quick results.
It is about:
-
Developing perspective
-
Observing trends over time
-
Building conviction gradually
The more you practice, the easier it becomes.
Final Thoughts
The fundamental analysis of a stock does not need to be complicated.
By focusing on just 7 key data points, you can:
-
Filter quality businesses
-
Understand financial strength
-
Build a structured approach
Start simple. Stay consistent. Keep learning.
Over time, what seems complex today will become second nature.
Keywords Covered:
Fundamental Analysis of a Stock, Stock Analysis Strategy, Financial Statement Analysis, ROE, Cash Flow, Debt Analysis, Valuation Metrics
This content is for educational purposes only and does not constitute investment advice.


Post Comment