Gold Price Movement: A Technical Analysis of the Last 5 Years
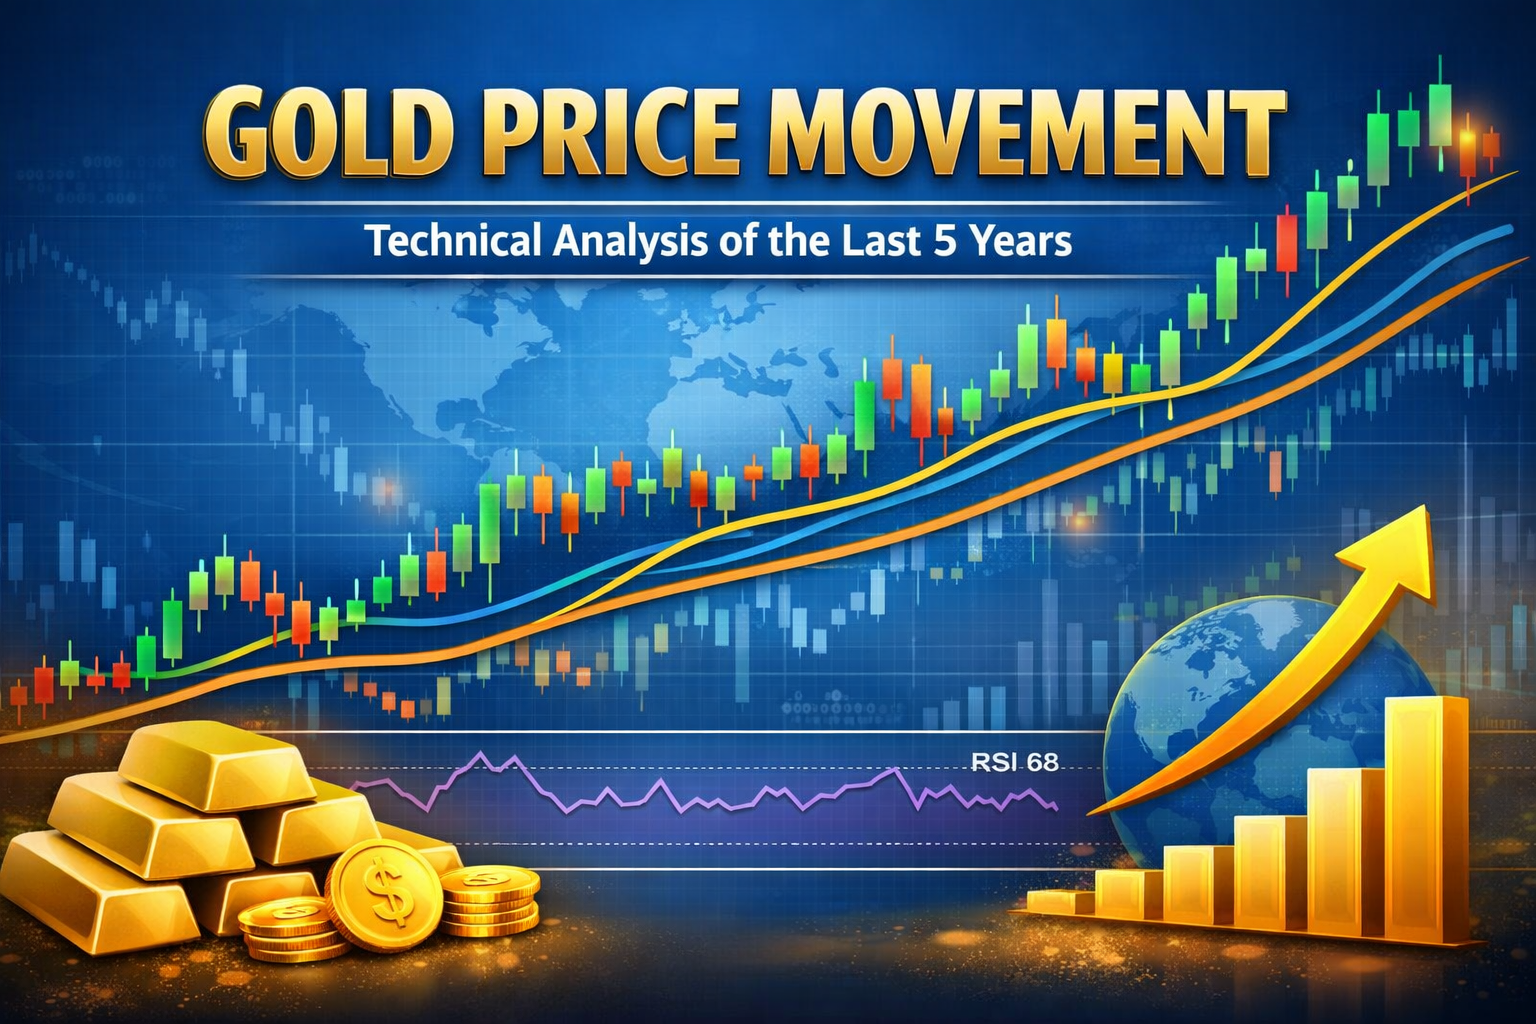
Gold has always held a unique position in global financial markets. Often considered a safe-haven asset, it reacts not just to supply and demand, but also to macroeconomic shifts, inflation expectations, and global uncertainty.
However, beyond fundamentals, the Gold price movement also follows clear technical structures that can be analyzed using basic indicators.
In this article, we break down the last 5 years of gold price movement using technical analysis, focusing on trends, support-resistance, and momentum — along with a year-on-year (YoY) perspective.
Why Analyze Gold Using Technical Analysis?
Gold behaves differently from equities, but technical analysis still applies because:
-
Price reflects global sentiment
-
Institutional activity leaves patterns
-
Trends and levels repeat over time
This makes gold an excellent asset to study market structure and trend behavior.
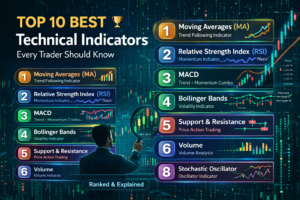
Basic Indicators Used in This Analysis
To keep things simple and practical, we focus on:
-
Moving Averages (Trend direction)
-
Support & Resistance (Key levels)
-
RSI (Momentum strength)
-
Price Structure (Higher highs / Lower lows)
Gold Price Movement (Last 5 Years – Year-on-Year Analysis)
2020 – Strong Bullish Breakout Phase
Technical View:
-
Gold entered a strong uptrend
-
Broke major resistance levels
-
Created new all-time highs
Indicators:
-
Price stayed above moving averages
-
RSI remained in bullish zone
Learning:
Breakouts with strong momentum often lead to extended trends
2021 – Consolidation Phase
Technical View:
-
Gold moved sideways after a strong rally
-
Formed a range-bound structure
Indicators:
-
Resistance held multiple times
-
RSI showed weakening momentum
Learning:
After strong rallies, markets often enter consolidation zones
2022 – Volatile & Uncertain Structure
Technical View:
-
Gold showed sharp swings
-
Failed to maintain trend direction
Indicators:
-
Frequent support and resistance tests
-
RSI fluctuating (no clear trend)
Learning:
High volatility phases often lead to false breakouts and confusion
2023 – Gradual Trend Recovery
Technical View:
-
Gold began forming higher lows
-
Slowly regained bullish structure
Indicators:
-
Moving averages started aligning upward
-
RSI improved gradually
Learning:
Trend reversals often start slowly with structure formation
2024–2025 – Strong Uptrend Continuation
Technical View:
-
Gold broke previous resistance
-
Continued bullish momentum
Indicators:
-
Price above key moving averages
-
Strong volume during breakouts
Learning:
When resistance breaks with confirmation, it often leads to trend continuation
Key Technical Patterns Observed in Gold
Across 5 years, some consistent patterns emerged:
1. Trend Cycles
Gold moved in clear phases:
-
Strong uptrend → consolidation → breakout
Understanding cycles helps in better timing decisions
2. Strong Respect for Support & Resistance
Gold repeatedly reacted at:
-
Previous highs
-
Key psychological levels
These levels act as decision zones
3. Momentum Shifts Before Major Moves
RSI and price structure often showed:
-
Weakening before corrections
-
Strength before breakouts
Momentum acts as an early signal
4. Breakout + Retest Pattern
Common pattern:
-
Breakout → Pullback → Continuation
This is one of the most reliable technical setups.
YoY Summary (Quick View)
| Year | Market Behavior | Technical Structure |
|---|---|---|
| 2020 | Strong Rally | Breakout Trend |
| 2021 | Sideways | Consolidation |
| 2022 | Volatile | Range + False Moves |
| 2023 | Recovery | Higher Lows |
| 2024–25 | Bullish | Trend Continuation |
Common Mistakes While Analyzing Gold
❌ Ignoring Global Context
Gold is influenced by global events — not just charts.
❌ Overtrading in Range Markets
Sideways markets often trap traders.
❌ Blind Indicator Use
Indicators must support price — not replace it.
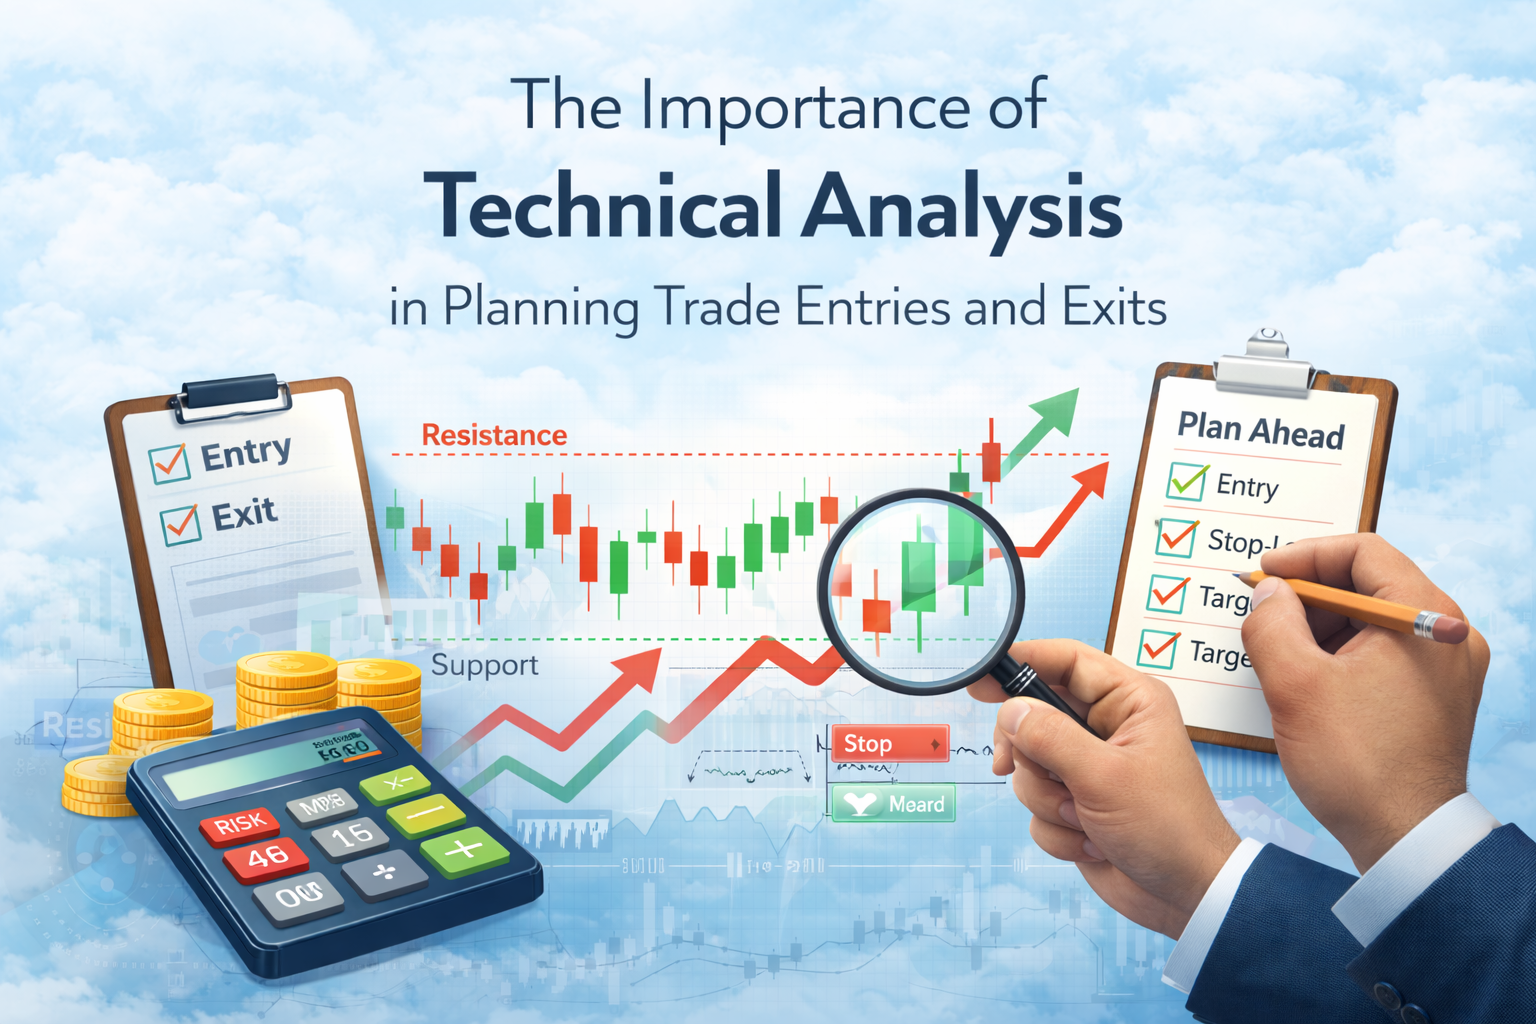
Practical Technical Strategy for Gold
If you want a simple approach:
Step 1: Identify Trend
Use moving averages or price structure
Step 2: Mark Key Levels
Support and resistance zones
Step 3: Watch Momentum
Use RSI to confirm strength
Step 4: Wait for Confirmation
Avoid entering on assumptions
Step 5: Manage Risk
Always define stop-loss and target
Final Thoughts
The Gold price movement over the past 5 years clearly shows that:
-
Markets move in cycles
-
Trends develop over time
-
Technical patterns repeat
Technical analysis does not predict exact outcomes, but it provides a structured framework to understand price behavior.
By focusing on:
-
Trend
-
Structure
-
Momentum
-
Key levels
you can significantly improve your ability to interpret gold and other asset classes.
Focus :
Gold Price Movement, Technical Analysis of Gold, Gold Trend Analysis, Support and Resistance, RSI Indicator, Market Structure
This content is for educational purposes only and does not constitute investment advice.


Post Comment