Past 5 Market Crashes and What Technical Analysis Teaches Me
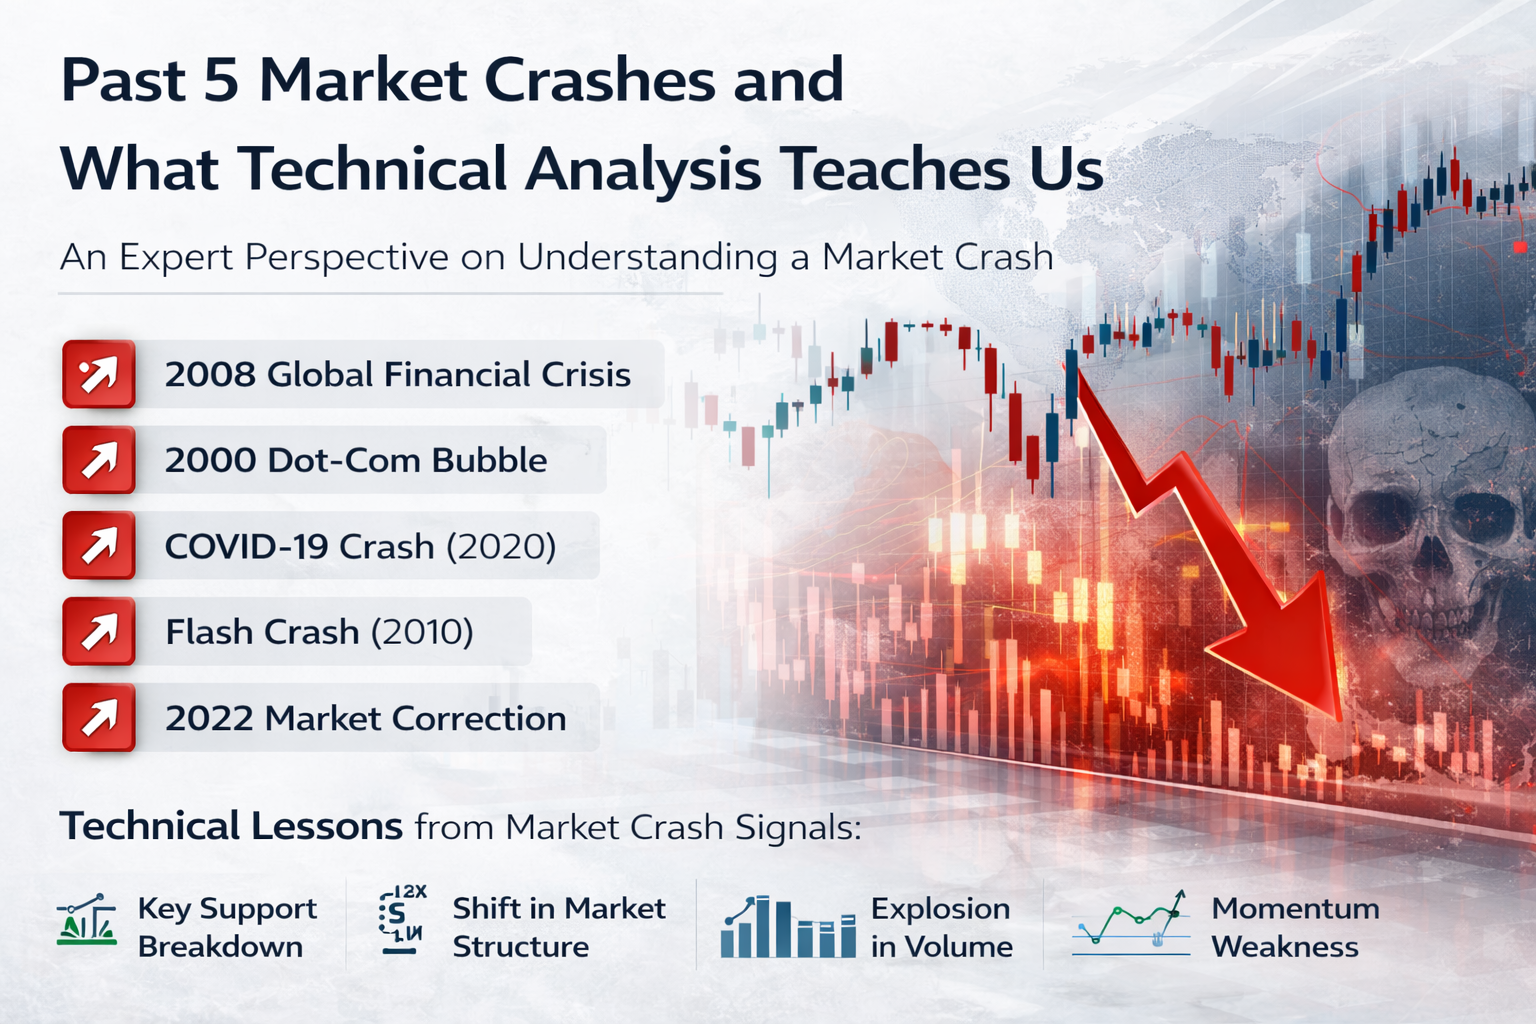
(An Expert Perspective on Understanding a Market Crash)
A market crash is often described as sudden, unpredictable, and driven by panic. But when observed through the lens of technical analysis, crashes are rarely random.
In fact, most major market crashes leave clear technical footprints before they unfold.
For traders and market observers, the goal is not to predict crashes perfectly — but to recognize early warning signals through price behavior, structure, and momentum.
In this article, we analyze five major market crashes and extract technical lessons that remain relevant across all markets.
1. The 2008 Global Financial Crisis
Technical Setup Before the Crash:
-
Major indices formed lower highs over time
-
Key support levels were repeatedly tested
-
Breakdown below long-term support triggered accelerated selling
Technical Signals:
-
Trend reversal from bullish to bearish
-
Moving averages started sloping downward
-
Increased volatility and wider price ranges
Key Learning:
Repeated support testing weakens the level
When price fails to hold a key support zone multiple times, it often leads to a strong breakdown.
2. The Dot-Com Bubble Crash (2000)
Technical Setup:
-
Parabolic uptrend in tech stocks
-
Extreme overextension from moving averages
-
Weak consolidation structures
Technical Signals:
-
RSI divergence (price rising, momentum weakening)
-
Failure to sustain breakout levels
-
Sharp rejection from highs
Key Learning:
Parabolic moves often end in sharp reversals
When price accelerates too quickly without proper structure, it creates fragile trends.
3. COVID-19 Crash (2020)
Technical Setup:
-
Strong uptrend before the crash
-
Sudden high-volume breakdown across global indices
Technical Signals:
-
Break of short-term support → followed by long-term support
-
Spike in volatility (large bearish candles)
-
Moving average crossovers turning bearish
Key Learning:
High volume breakdown confirms panic selling
When price breaks key levels with strong volume, it indicates institutional participation.
4. Flash Crash (2010)
Technical Setup:
-
Market in a relatively stable trend
-
Sudden liquidity gap
Technical Signals:
-
Extremely fast price movement
-
Lack of support zones during the fall
-
Immediate recovery after sharp drop
Key Learning:
Low liquidity zones create extreme volatility
Not all crashes follow structure — some are driven by liquidity imbalances.
5. 2022 Global Market Correction
Technical Setup:
-
Extended bullish cycle post-2020
-
Formation of distribution zones at highs
Technical Signals:
-
Sideways movement (range-bound market)
-
Lower highs within the range
-
Breakdown from consolidation
Key Learning:
Distribution phases precede major corrections
When price consolidates at highs with weakening momentum, it often signals smart money exit.
Common Technical Patterns Across All Market Crashes
Despite different causes, every market crash shares certain technical characteristics:
1. Breakdown of Key Support Levels
Support levels act as demand zones. Once broken, they often turn into resistance.
2. Shift in Market Structure
-
From higher highs → to lower highs
-
From bullish → to bearish trend
3. Increase in Volatility
Crashes are always accompanied by:
-
Larger price swings
-
Faster movements
4. Momentum Weakness Before the Fall
Indicators like RSI and MACD often show:
-
Divergence
-
Loss of strength
5. Volume Expansion
Strong selling pressure is confirmed by:
-
Increased trading volume
-
Institutional activity
Early Warning Signals of a Market Crash
Technical analysis does not predict crashes — but it highlights risk zones.
Watch for:
-
Repeated failure at resistance
-
Weak breakouts
-
Lower highs formation
-
Breakdown from consolidation
-
Increasing volatility without direction
These signals often appear before major declines.
Common Mistakes Traders Make During a Market Crash
❌ Ignoring Trend Reversal
Holding bullish bias even after clear structure change.
❌ Buying Every Dip
Not every dip is a buying opportunity — especially in a downtrend.
❌ Overlooking Volume
Price without volume confirmation can be misleading.
❌ Emotional Decision-Making
Fear and panic often lead to poor execution.
Technical Strategy During a Market Crash
Instead of reacting, focus on structure:
✔ Identify Trend
Confirm whether the market has shifted to a downtrend.
✔ Mark Key Levels
Support becomes resistance after breakdown.
✔ Wait for Pullbacks
Avoid chasing price — wait for structured entries.
✔ Manage Risk
Use stop-loss and position sizing.
The Bigger Perspective
A market crash is not just a fall — it is a transition phase.
It shifts the market from:
-
Euphoria → to fear
-
Expansion → to contraction
From a technical perspective, crashes are simply:
Strong bearish trends driven by breakdowns and momentum shifts
Final Thoughts
Every market crash teaches the same lesson:
Price leaves clues before major moves — if you know where to look.
By focusing on:
-
Market structure
-
Support and resistance
-
Momentum
-
Volume
you can develop a deeper understanding of how crashes unfold.
Technical analysis does not eliminate uncertainty — but it provides a framework to navigate it with clarity.
In the end, success is not about avoiding every crash —
it is about understanding the signals and adapting accordingly.
Keyword Covered:
Market Crash, Technical Analysis, Support and Resistance, Trend Reversal, Volume Analysis, Market Structure
This content is for educational purposes only and does not constitute investment advice.


Post Comment