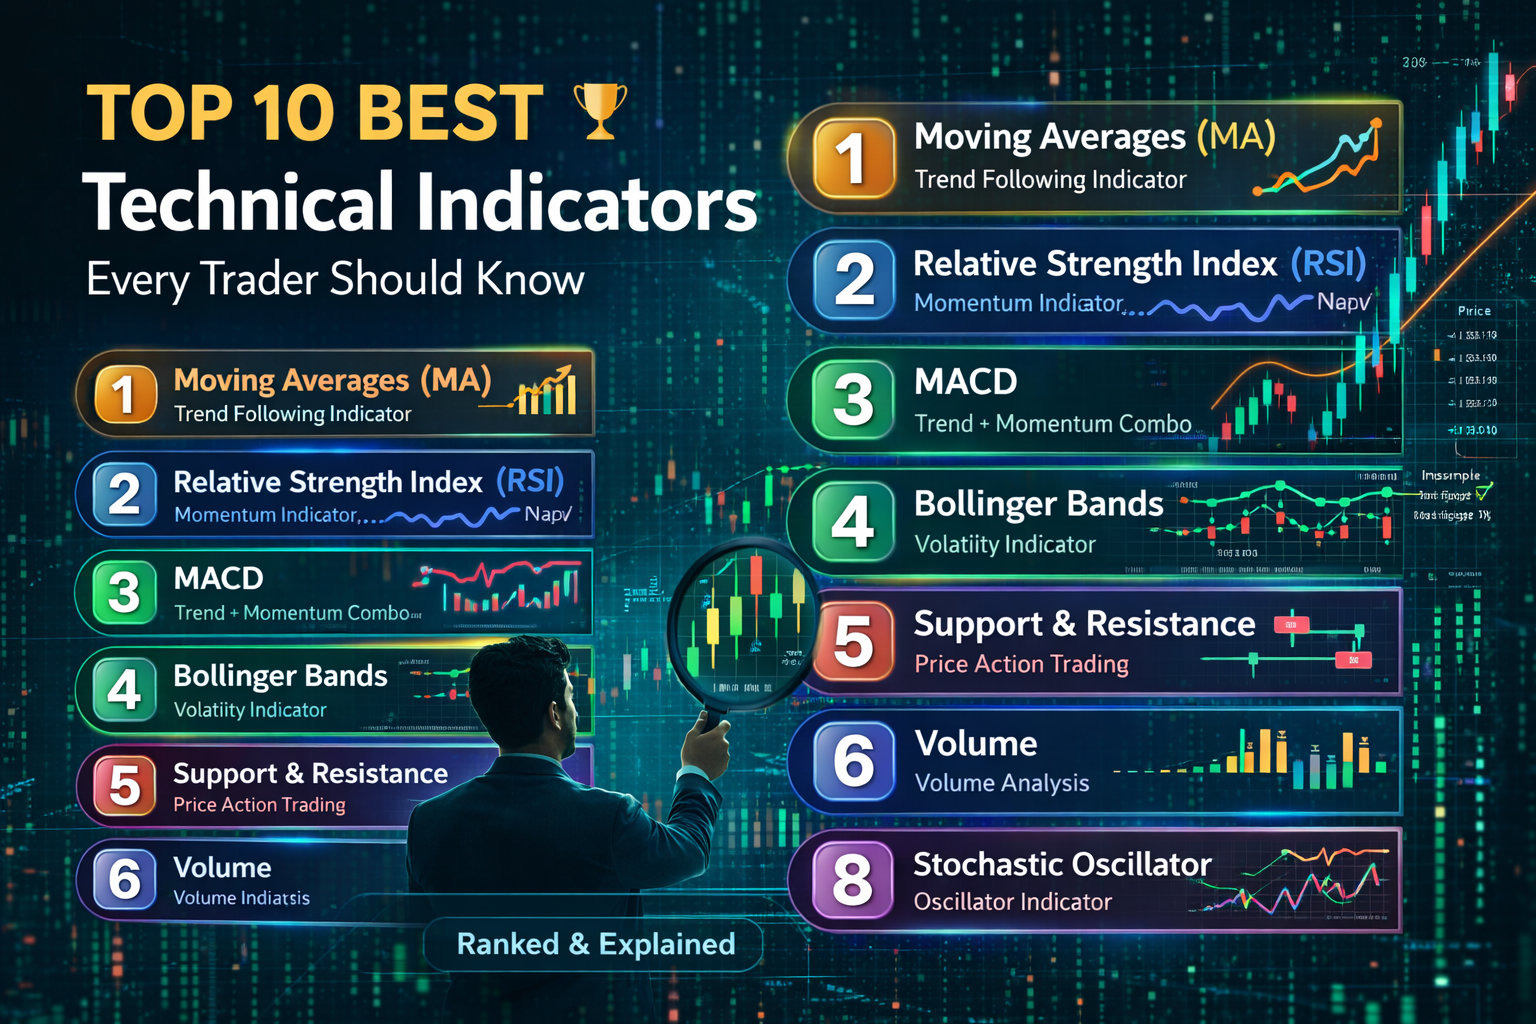
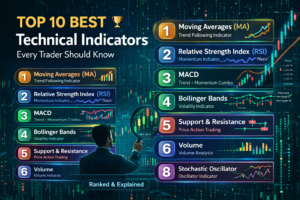
Top 10 Best Technical Indicators Every Trader Should Know (Ranked & Explained)
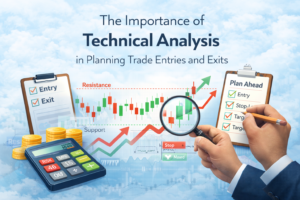
In the world of trading, technical indicators play a crucial role in helping traders interpret price behavior, identify trends, and make structured decisions. While no indicator guarantees success, using the right combination can significantly improve clarity and consistency.
With countless tools available, the challenge is not access — it’s knowing which indicators actually matter.
In this guide, we rank the Top 10 globally accepted technical indicators, based on usability, reliability, and real-world application. These are widely used across equities, forex, commodities, and crypto markets.
 1. Moving Averages (MA) — The Foundation of Trend Analysis
Why it’s #1: Simple, effective, and universally used.
Moving averages smooth out price data to identify trends over time.
Types:
-
Simple Moving Average (SMA)
-
Exponential Moving Average (EMA)
Use cases:
-
Identifying trend direction
-
Dynamic support and resistance
-
Crossover strategies (Golden Cross / Death Cross)
 Trending keyword: Trend Following Indicator
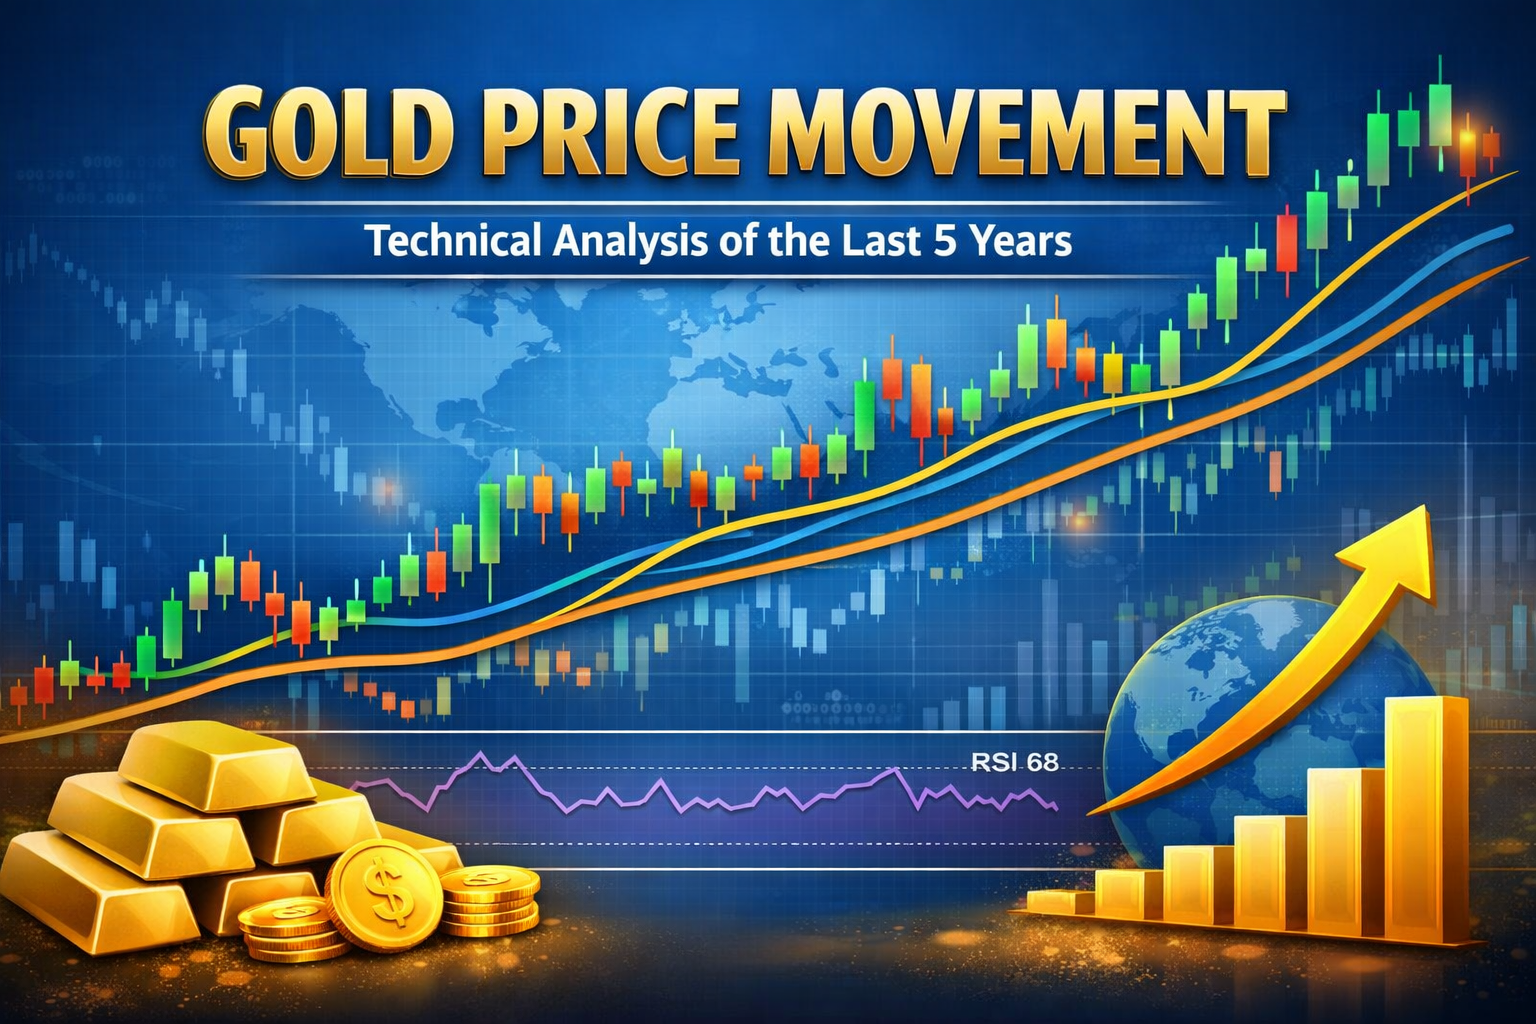
 2. Relative Strength Index (RSI) — Momentum Master
RSI measures the speed and change of price movements.
Range: 0 to 100
-
Above 70 → Overbought
-
Below 30 → Oversold
Why traders love it:
-
Easy to interpret
-
Helps identify potential reversals
Trending keyword: Momentum Indicator
 3. MACD (Moving Average Convergence Divergence)
MACD is a powerful combination of trend and momentum.
Components:
-
MACD line
-
Signal line
-
Histogram
Use cases:
-
Trend confirmation
-
Momentum shifts
-
Entry timing
Trending keyword: Trend + Momentum Combo
 4. Bollinger Bands — Volatility Indicator
Bollinger Bands measure market volatility using three bands:
-
Upper band
-
Middle (moving average)
-
Lower band
What it tells you:
-
Market expansion and contraction
-
Potential breakout zones
Trending keyword: Volatility Indicator
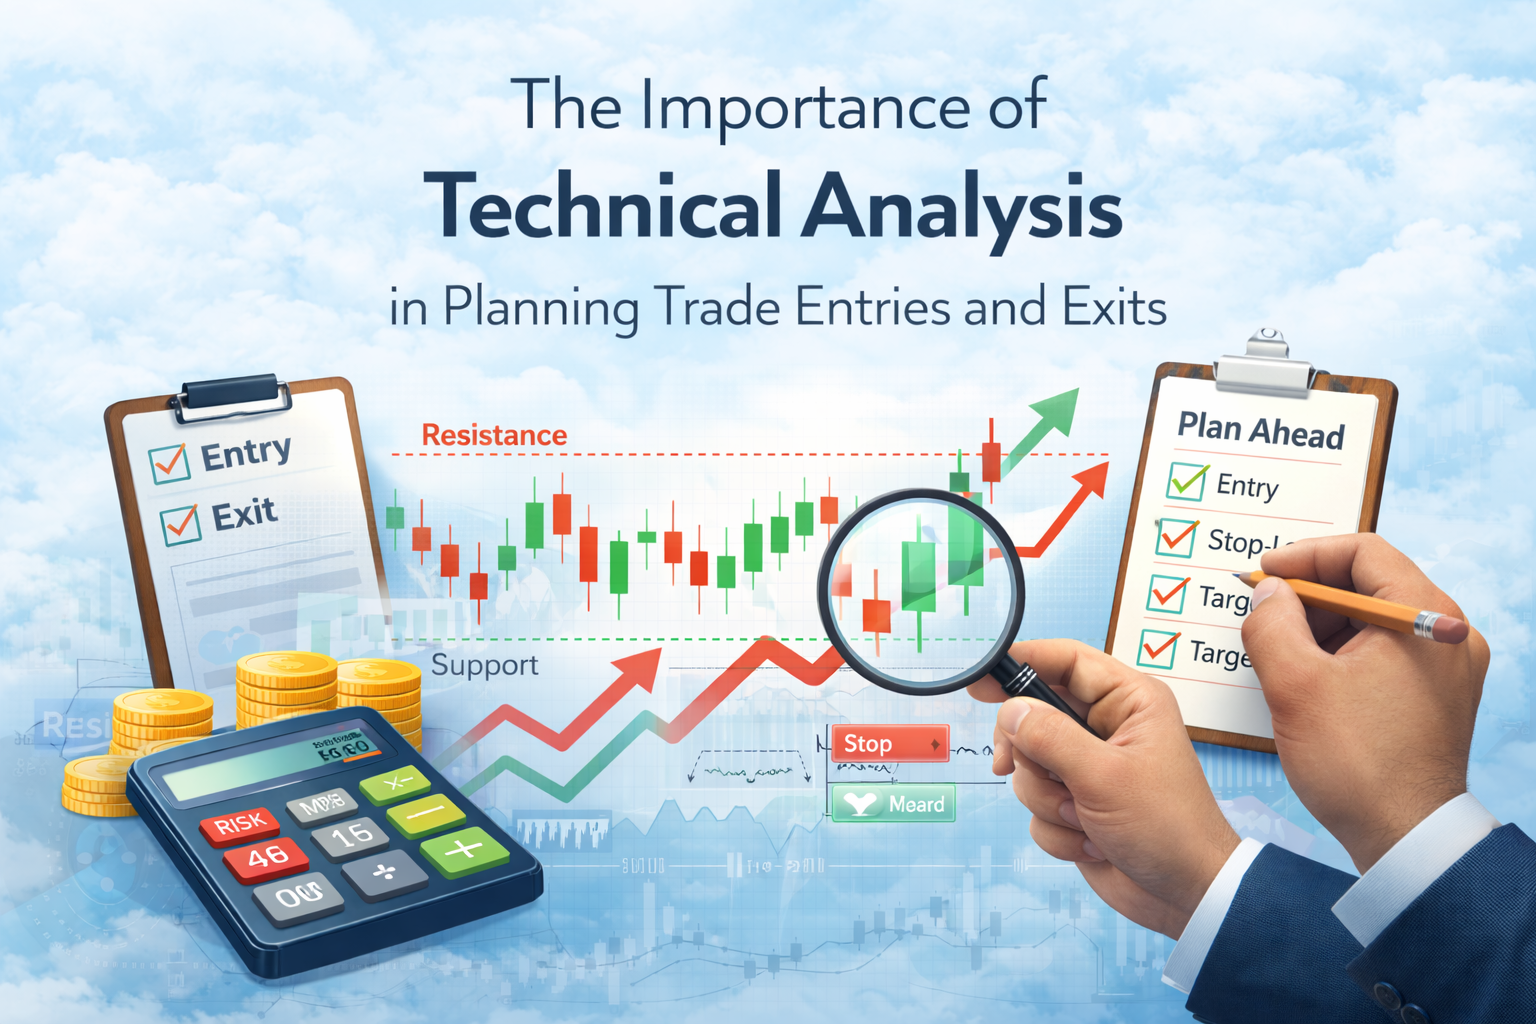
 5. Support & Resistance (Price Action Tool)
Not a traditional indicator, but one of the most powerful tools.
Why it ranks high:
-
Used by institutional traders
-
Works across all markets
Use cases:
-
Entry and exit planning
-
Stop-loss placement
-
Market structure understanding
Trending keyword: Price Action Trading
6. Volume — The Hidden Strength Indicator
Volume shows how much participation is behind a price move.
Why it matters:
-
Confirms strength of trends
-
Identifies accumulation and distribution
Example:
-
Rising price + high volume = strong move
-
Rising price + low volume = weak move
Trending keyword: Volume Analysis
 7. Fibonacci Retracement — Key Level Tool
Fibonacci levels help identify potential retracement zones.
Common levels:
-
38.2%
-
50%
-
61.8%
Why traders use it:
-
Works well in trending markets
-
Helps find pullback entries
Trending keyword: Fibonacci Trading Strategy
 8. Stochastic Oscillator — Short-Term Momentum
Similar to RSI but more sensitive.
Range: 0 to 100
-
Above 80 → Overbought
-
Below 20 → Oversold
Best for:
-
Range-bound markets
-
Short-term trading setups
Trending keyword: Oscillator Indicator
9. Average True Range (ATR) — Volatility & Risk Tool
ATR measures market volatility, not direction.
Why it’s useful:
-
Helps set stop-loss levels
-
Indicates market activity
Higher ATR = Higher volatility
Lower ATR = Calm market
Trending keyword: Risk Management Indicator
10. VWAP (Volume Weighted Average Price)
VWAP is widely used by institutional traders.
What it shows:
-
Average price based on volume
Why it’s powerful:
-
Identifies fair value
-
Used for intraday trading
Trending keyword: Institutional Indicator
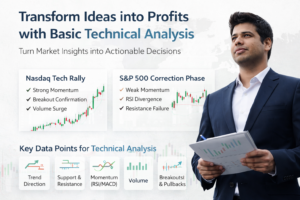
 How to Use These Indicators Effectively
Using indicators is not about stacking multiple tools on a chart.
Instead, focus on:
-
Combining 2–3 indicators
-
Understanding their purpose
-
Keeping charts clean
 Best Combinations:
-
Moving Average + RSI → Trend + Momentum
-
Support/Resistance + Volume → Structure + Confirmation
-
Bollinger Bands + RSI → Volatility + Reversal
 Common Mistakes to Avoid
 Indicator Overload
Too many indicators create confusion.
Blind Dependence
Indicators should support analysis, not replace it.
Ignoring Market Context
Indicators work best when aligned with trend and structure.
 Final Thoughts
Technical indicators are tools — not shortcuts.
The real edge comes from:
-
Understanding how they work
-
Applying them consistently
-
Combining them with price action
If used correctly, these top 10 indicators can help you:
-
Improve entry and exit timing
-
Manage risk effectively
-
Build a structured trading approach
Start simple, stay consistent, and focus on clarity over complexity.
Keywords Covered:
Technical Indicators, RSI Indicator, MACD Strategy, Moving Average Trading, Bollinger Bands, Volume Analysis, Fibonacci Retracement, VWAP Indicator, Price Action Trading, Momentum Indicator
This content is for educational purposes only and does not constitute investment advice.
Share this content:


Post Comment