


₹7 Lakh Crore Wiped Out — Is This a Crash or a Buying Opportunity?
In This Article
Toggle
🔴 Live Market Alert — Mint & Print Research Desk
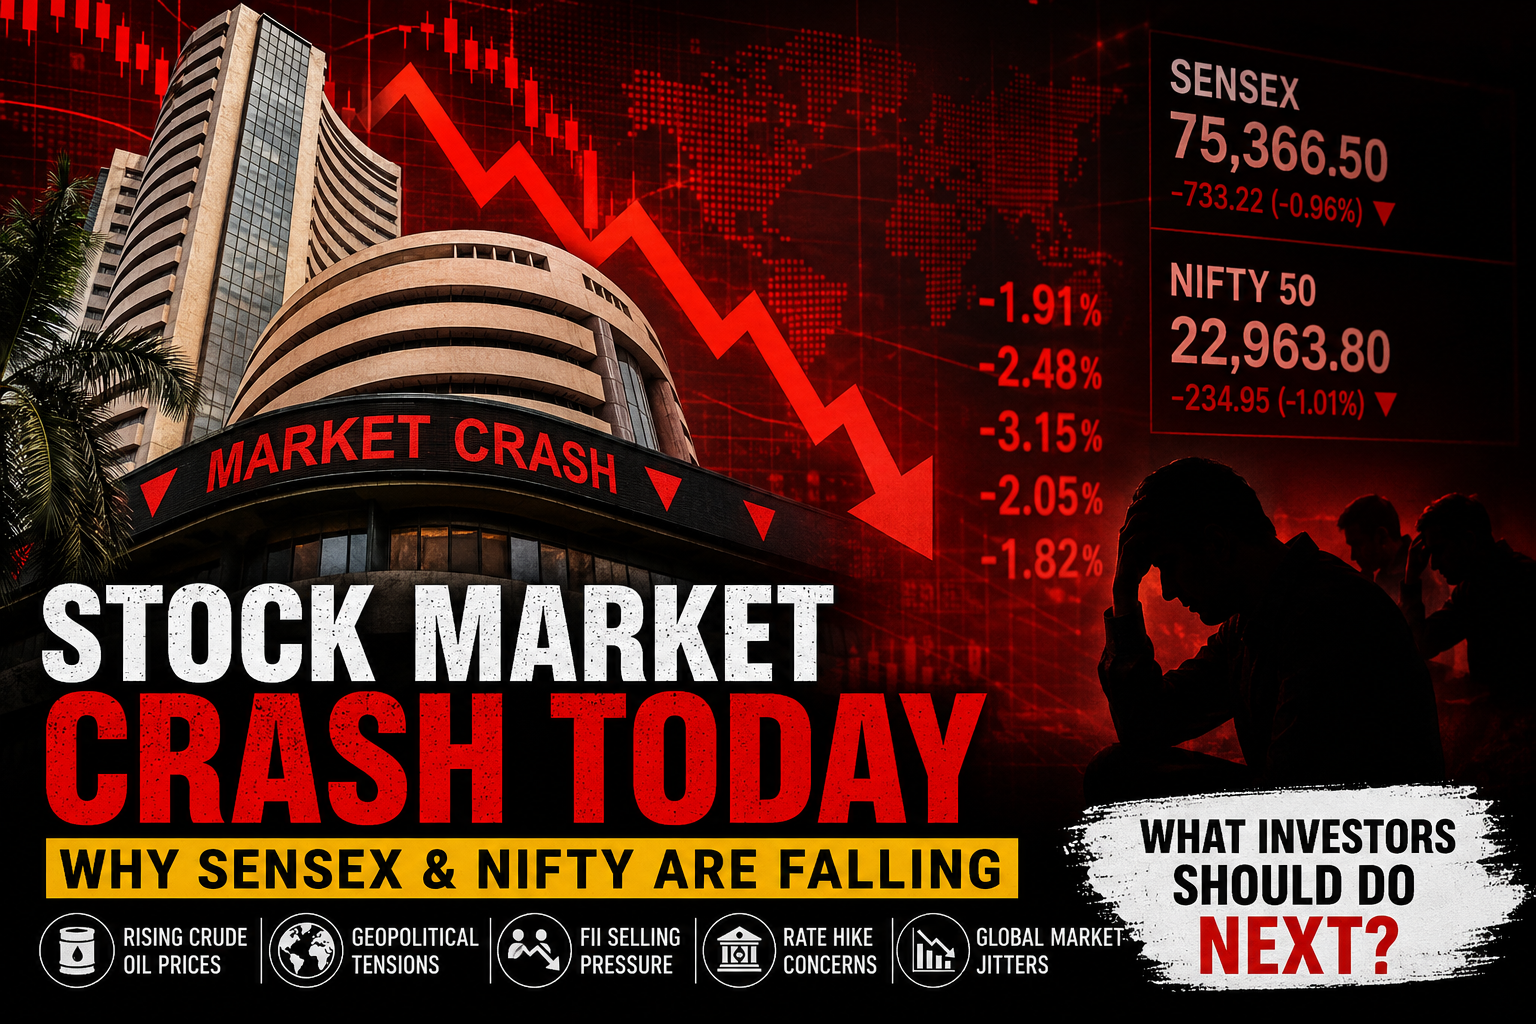
₹7 Lakh Crore Wiped Out — Is This a Crash or a Buying Opportunity?
Sensex drops 700+ points. Nifty breaks key support. FIIs pulling billions. Here's exactly what's driving the sell-off — and what disciplined investors should do right now.
−700+Sensex drop (pts)
₹7L CrWealth erased
5 factorsDriving the fall
10 minRead this first
Stock Market Crash Today: Indian stock markets have witnessed intense volatility over the last few trading sessions, leaving investors worried about whether this stock market crash today is a temporary correction or the beginning of a larger market downturn. With Sensex and Nifty witnessing sharp declines, investors are searching for answers about the stock market crash today and what it means for their portfolios.
The recent stock market crash pushed the Sensex down by more than 700 points and dragged the Nifty 50 below critical support levels, erasing nearly ₹5–7 lakh crore of investor wealth in a matter of hours.But before you panic, understand this: not every sharp market decline is a crash. Some are corrections. Some are buying opportunities. And some are early warnings of deeper trouble. The key is understanding which one you're dealing with — and that requires analysing the real data, not just the headlines.
In this detailed article, we'll walk through the exact causes of this stock market decline, examine historical precedents with real data, analyse sector-wise impact, and lay out a clear action plan for investors at every stage — whether you're a beginner SIP investor or a seasoned portfolio holder.
⚠ Mint & Print Market Alert
The current sell-off is being driven by a combination of global and domestic triggers acting simultaneously. When multiple risk factors align at once, markets tend to overshoot on the downside — often creating exceptional buying opportunities for patient, informed investors.
How Deep Are Market Corrections Historically?
Before we discuss today's crash, it's critical to put the current decline in perspective. Indian markets have survived and recovered from every single correction in history — including crashes far more severe than this one. The chart below shows the depth and duration of major Nifty corrections since 2000:
Major Nifty 50 Corrections — Depth & Recovery (2001–2024)
Source: NSE Historical Data | Decline measured from peak-to-trough
| Period | Trigger | Peak-to-Trough Fall | Duration (Months) | Recovery Time | Classification |
|---|---|---|---|---|---|
| 2001–2002 | Dot-com bust + 9/11 | −55% | 18 | ~3 years | Major Crash |
| 2004 | Election result shock | −17% | 1 | 3 months | Correction |
| 2008–2009 | Global Financial Crisis | −60% | 15 | ~2 years | Major Crash |
| 2011 | European Debt Crisis | −28% | 8 | ~18 months | Sharp Correction |
| 2015–2016 | China slowdown + FII selling | −22% | 6 | ~12 months | Correction |
| 2018 | IL&FS crisis + oil prices | −15% | 4 | ~9 months | Correction |
| Mar 2020 | COVID-19 pandemic | −38% | 1.5 | 6 months | Flash Crash |
| 2022 | Global rate hikes + Russia-Ukraine | −17% | 6 | ~8 months | Correction |
| 2024–25 | FII selling + valuation concerns | −14% | 4 | Recovering | Correction |
The pattern is clear: every single market crash in Indian history has eventually recovered and gone on to make new highs. The 2008 crash — where the Nifty fell 60% — seemed catastrophic at the time. Within two years, the index had fully recovered. The COVID crash of March 2020 was the fastest — the market bottomed and recovered within six months.
📌 Mint & Print Historical Insight
Investors who stayed invested during every major Nifty crash since 2000 and continued their SIPs saw their wealth multiply 15–20× over the next two decades. The investors who suffered permanent losses were those who panic-sold at the bottom.
5 Real Reasons Behind the Stock Market Crash Today
The current market decline is not being driven by a single factor. Several global and domestic risks have converged simultaneously — creating a "risk-off" environment where investors are reducing equity exposure and rotating toward safer assets like gold, bonds, and cash.
1 Escalating Middle East Geopolitical Tensions
The most immediate trigger behind the current stock market crash has been the sharp escalation of geopolitical tensions in the Middle East. Rising hostilities involving Iran, Israel, and the United States have significantly increased fears of disruptions to global oil supply routes — particularly through the Strait of Hormuz, through which approximately 20% of the world's daily oil supply passes.
When geopolitical risk rises, global fund managers adopt a "risk-off" stance — selling equities across all major markets and moving capital into safe havens like US Treasury bonds, gold, and the US dollar. This indiscriminate selling hits both developed and emerging markets simultaneously. For India — a country that imports over 85% of its crude oil requirements — the impact is compounded because rising oil prices directly inflate the country's import bill, widen the current account deficit, and weaken the rupee.
2 Surging Crude Oil Prices Are Squeezing Indian Equities
Crude oil prices have seen a sharp spike in recent sessions, and this is one of the most direct and impactful drivers of the Indian stock market sell-off. India is among the world's largest oil importers — and every $10 rise in crude oil prices adds approximately ₹80,000–₹1,00,000 crore to India's annual import bill, widens the fiscal deficit by around 0.4–0.5% of GDP, and exerts immediate upward pressure on domestic inflation.
Crude Oil Price vs Nifty 50 Inverse Correlation (2019–2024)
When crude spikes, Nifty typically corrects. Source: Bloomberg, NSE
The sectors most affected by rising oil prices in India include aviation (jet fuel costs), paints and chemicals (petrochemical derivatives), logistics and transportation (diesel costs), FMCG companies (packaging and distribution costs), and automobile manufacturers (input cost inflation). Analysts estimate that a sustained crude price above $100/barrel could trim Nifty EPS estimates by 4–6% for FY26, directly justifying the lower index valuation we're seeing today.
3 FII Selling: Foreign Investors Are Pulling Out
Foreign Institutional Investors (FIIs) have been net sellers of Indian equities across multiple consecutive sessions. This is one of the most powerful short-term forces that can move Indian markets, given that FIIs collectively own approximately 18–22% of NSE-listed market capitalisation. When they sell, the sheer volume of supply overwhelms domestic buying, leading to rapid index declines.
| Period | FII Net Activity | Net Flows (₹ Crore) | Nifty Response | Primary Reason |
|---|---|---|---|---|
| Oct–Dec 2021 | Net Sellers | −₹38,521 Cr | −8% | US Fed tapering signal |
| Jan–Jun 2022 | Net Sellers | −₹2,17,359 Cr | −17% | Russia-Ukraine + rate hikes |
| Oct 2022 | Net Buyers | +₹7,624 Cr | +10% | Dollar weakness, India stability |
| Sep–Oct 2024 | Net Sellers | −₹1,14,446 Cr | −7% | China stimulus + premium valuations |
| Current Phase | Net Sellers | Data pending | −4% to −8% | Geopolitical risk + oil + dollar |
The key question is: when will FII selling stop? Historically, FII outflows tend to reverse when the US dollar weakens, when emerging market valuations become attractive relative to developed markets, and when geopolitical uncertainty subsides. DIIs (Domestic Institutional Investors) — primarily mutual funds — have been absorbing much of this selling, but their firepower is finite and cannot indefinitely offset FII exits of this scale.
4 US Federal Reserve & Global Inflation Concerns
Global markets are in a state of anxiety over the trajectory of US inflation and the Federal Reserve's interest rate decisions. When the US Fed maintains higher-for-longer interest rates — or signals additional hikes — it creates several negative ripple effects for Indian and other emerging market equities.
Higher US rates make US Treasury bonds more attractive relative to emerging market equities, causing capital to flow from risky assets toward safe fixed income. A stronger US dollar (a consequence of higher US rates) puts pressure on the Indian rupee — and a weakening rupee increases India's import costs (especially oil), raises corporate input costs, and erodes foreign investor returns in dollar terms. This creates a vicious cycle: dollar strengthens → rupee weakens → import inflation rises → RBI raises rates → corporate earnings fall → equity valuations compress.
5 Global Technology & AI Sector Correction
A significant contributing factor to the global market weakness — which has spilled over into India — is the ongoing correction in high-valuation technology and AI-related stocks. After a prolonged rally driven by AI optimism, several leading global tech companies are experiencing profit booking as investors question whether earnings growth justifies stretched valuations.
For India, this directly impacts IT and technology companies — which collectively represent approximately 14–16% of Nifty 50 weighting. Companies like TCS, Infosys, HCL Technologies, and Wipro are highly exposed to global tech spending cycles. A slowdown in deal volumes or margin pressure in global tech translates immediately into Indian IT stock weakness — adding another layer of downward pressure on the benchmark indices.
Current Market Decline: Crash vs Correction — What the Data Says
The single most important question right now is: are we experiencing a normal correction, or the beginning of a deeper crash? The answer matters enormously for how you should position your portfolio.
Nifty 50 — Correction Classification by Magnitude
How does the current fall compare to historical benchmarks?
A market correction is technically defined as a fall of 10–20% from recent highs. It is a normal, healthy part of any bull market cycle. The average bull market in India experiences 2–3 corrections of 10–20% before completing its full cycle. A crash, by contrast, is typically defined as a fall of more than 20% — and historically has been associated with specific structural economic shocks (banking failures, pandemic shutdowns, global financial crises) rather than cyclical concerns like oil prices or geopolitical tensions.
Based on current data, the present decline appears to fall in the sharp correction category rather than a full-blown crash. Key support levels for Nifty — around the 200-day moving average — are being tested, but have not been decisively broken. Corporate earnings remain broadly intact. Banking system health is strong. And the RBI's foreign exchange reserves remain near record highs, providing significant buffer against external shocks.
✅ Mint & Print Assessment
This appears to be a geopolitically-driven risk-off correction, not a structural economic crash. Unless crude oil sustains above $110/barrel for an extended period AND the US Fed re-accelerates rate hikes simultaneously, a decline exceeding 20% from current levels appears unlikely given India's underlying economic fundamentals.
Which Sectors Are Most Affected — and Which Ones Are Resilient?
Not all sectors are equally vulnerable during this crash. Understanding the sectoral impact helps you make smarter decisions about where your money should — and shouldn't — be right now.
✈️
Aviation
High Impact
Jet fuel comprises 30–40% of airline operating costs. A $10/barrel rise in crude directly compresses airline margins. Expect earnings downgrades for IndiGo and SpiceJet if oil stays elevated.
💻
IT & Technology
High Impact
Global tech slowdown is directly hitting Indian IT deal pipelines. With Nifty IT comprising ~15% of the index, weakness here has outsized market impact. Monitor TCS and Infosys guidance closely.
🏦
Banking & Financial Services
Medium Impact
Banks are facing pressure from economic growth concerns and potential rate volatility. However, Indian bank balance sheets are among the strongest they've been in a decade — NPAs are at multi-year lows, providing a buffer.
🏗️
Infrastructure & Capital Goods
Lower Impact
Government capex-driven sectors are more insulated. The Centre's infrastructure spending is budget-committed and less susceptible to global risk-off sentiment. These stocks often recover first in a rebound.
🛒
FMCG
Medium Impact
Input cost inflation from crude (packaging, logistics) will pressure margins. However, FMCG is a defensive sector — volumes remain stable. Companies with pricing power can partially pass on costs.
🌿
Pharma & Healthcare
Lower Impact
Pharma is largely a domestic demand story and is relatively uncorrelated to global risk events. This sector often acts as a safe haven within Indian equities during global sell-offs.
🏭
Oil & Gas (PSU)
Mixed Impact
Upstream oil companies like ONGC benefit from higher crude prices, but downstream companies (HPCL, BPCL) face margin pressure if government restricts price hikes to control inflation.
📊
Mid & Small Caps
High Volatility
Small and mid-cap stocks typically fall 1.5–2× the decline in large caps during risk-off events due to lower liquidity and higher retail investor participation. These segments require the most patience.
What Should Investors Do? A Clear Action Plan
Market crashes — even mild ones — trigger powerful emotional responses: fear, the urge to sell everything, the sense that the world is ending. But history is unambiguous: the investors who build wealth are those who act rationally when others are acting emotionally. Here is a practical, evidence-based action plan for different types of investors.
✅ What Smart Investors Do
- 🔄Continue or increase SIP investments — you're buying more units at lower prices, which lowers your average cost (rupee cost averaging)
- 🎯Review your portfolio quality — does every stock you hold have a solid business model, low debt, and consistent earnings growth?
- 💰Deploy any idle cash gradually in tranches — don't try to catch the exact bottom, deploy 20–25% of surplus cash every 2–3 weeks
- 📊Focus on quality large-caps first — during uncertainty, stick to Nifty 50 or Nifty Next 50 constituents with proven track records
- 📰Read fundamentals, not just headlines — check quarterly earnings, management commentary, and sector-level data
- 🛡️Rebalance toward defensive sectors like Pharma, FMCG, and Infrastructure if you're risk-averse
❌ What Destroys Wealth
- 🚨Panic selling your entire equity portfolio — you crystallise paper losses into permanent losses
- 📉Trying to "time the market" by selling now and planning to buy back lower — studies show retail investors almost always buy back at higher prices
- ⚡Taking on leveraged positions (margin, F&O) during high volatility — leverage amplifies losses and can lead to margin calls
- 📱Making investment decisions based on social media, WhatsApp forwards, or unverified "tips" during crashes
- 🎲Buying highly speculative small-caps or penny stocks on the belief that "everything will recover" — not all stocks recover
- ⏸️Pausing SIP investments — this is precisely the wrong time to stop; you need the lower prices to improve long-term returns
Key Indicators to Monitor Over the Coming Weeks
The market's direction over the next 4–8 weeks will be largely determined by how these key macro and market indicators evolve. Monitor them weekly:
🛢️
Brent Crude
Watch: $85–100/bbl level
💵
USD/INR
Watch: ₹84–87 range
🏛️
US 10-yr Yield
Watch: above 4.5%?
🌍
FII Flows
Reversal = buy signal
📈
Nifty 200-DMA
Critical support zone
🏭
Corporate Earnings
Q1 FY26 results key
🌡️
India CPI Inflation
Watch for above 5.5%
🗺️
Middle East Tensions
Strait of Hormuz risk
🇺🇸
US Fed Commentary
Pivot = global rally
The SIP Investor's Hidden Advantage During Market Crashes
If you're a regular SIP investor, here's data that should make you feel genuinely optimistic about market crashes — counterintuitive as that sounds. The chart below shows how a ₹10,000/month SIP in a Nifty 50 Index Fund would have performed if started just before the COVID crash versus missing the crash entirely:
SIP ₹10,000/month — Crash Investor vs Normal Start (Jan 2019 → Dec 2023)
Investor A started Jan 2019 (experienced full COVID crash). Investor B started Jul 2020 (missed crash). Source: Indicative simulation based on NSE data.
The data reveals a powerful truth: Investor A, who started their SIP before the crash, ended up with a higher corpus than Investor B, who started after the crash ended. This is the power of rupee cost averaging — buying more units when prices are low means your average cost per unit is lower, and when markets recover, you benefit proportionally more. Every market crash is, in effect, a discount sale on quality Indian businesses. Long-term SIP investors should welcome — not fear — corrections.
📌 Mint & Print Final Verdict
This Is a Fear-Driven Correction, Not a Structural Crash — And That Changes Everything
The current stock market sell-off is painful, headline-grabbing, and uncomfortable — but it does not exhibit the structural characteristics of a prolonged market crash. India's banking system is healthy, corporate earnings are broadly intact, government fiscal policy is stable, and the RBI has significant ammunition to respond if needed.
The triggers — geopolitical tensions, oil prices, FII selling — are real and material. But they are also transient. Geopolitical events historically resolve. Oil prices are mean-reverting. FII outflows reverse when relative valuations improve and risk appetite returns. What remains constant is India's long-term structural growth story: rising consumption, digital adoption, manufacturing revival, and a young demographic pyramid.
The real question is not whether this correction will end. It will. The question is: will you be invested when it does?
Frequently Asked Questions About Stock Market Crashes
These are the questions we receive most during periods of market volatility — answered in detail to help you make informed decisions.
A stock market correction is technically defined as a decline of 10% to 20% from a recent peak. Corrections are completely normal and happen regularly — the average bull market experiences 3–4 corrections of 10%+ before peaking. They are usually triggered by short-term concerns: geopolitical events, inflation data surprises, profit booking, or sector-specific weakness. Corrections typically resolve within 3–9 months as fundamentals reassert themselves.
A stock market crash is a far more severe event — typically defined as a decline exceeding 20–30% or more within a short period, often accompanied by panic selling, credit market disruptions, and structural economic problems. Crashes like 2008 or the dot-com bust are driven by fundamental breakdowns: banking system failures, excessive leverage unwinding, or once-in-a-generation economic shocks.
To assess which one we're in, look at three things: (1) Are corporate earnings deteriorating significantly? If quarterly results remain broadly in-line with estimates, it's likely a correction. (2) Is the banking and credit system under stress? Banking system stress — rising NPAs, credit market freezes — is the hallmark of a crash, not a correction. (3) Are the triggers transient or structural? Oil prices, geopolitics, and FII flows are transient. Structural breakdown of the financial system is not.
Based on current data — stable bank balance sheets, broadly intact corporate earnings, and transient geopolitical triggers — the current decline shows the characteristics of a sharp correction rather than a structural crash. However, investors should continue monitoring crude oil prices and FII flows for escalation signals.
Stopping your SIP during a market crash is one of the most financially damaging decisions a retail investor can make, even though it feels instinctively correct. Here's why:
SIP (Systematic Investment Plan) works on the principle of rupee cost averaging. When markets fall, the NAV of your mutual fund also falls — meaning your fixed monthly SIP amount buys more units than it would at higher prices. These extra units, purchased at discounted prices, are what drive superior long-term returns when markets recover.
Consider this: if you invest ₹10,000/month and Nifty falls 20%, your SIP buys approximately 25% more units than it did at the peak. When the market recovers to its previous high — which all historical data shows it eventually does — those extra units represent pure compounded gains for you.
Multiple studies of SIP investors in India (conducted by AMFI and leading fund houses like HDFC AMC and SBI Mutual Fund) consistently show that investors who continued or increased their SIPs during the 2008, 2020, and 2022 downturns generated 15–22% CAGR over the subsequent 5-year periods, versus 10–13% for investors who paused SIPs during those corrections.
The only valid reason to pause a SIP is if you genuinely need the cash for a critical short-term financial obligation. If you're pausing simply because markets are falling — that is the exact wrong reason, and you are making a decision based on fear rather than financial logic.
The recovery time for Indian markets after a crash or correction varies significantly based on the severity of the downturn and its underlying cause. Here's the historical data:
- Mild corrections (10–15% falls): Typically recover within 3–6 months. Examples: 2004 election shock (recovered in ~3 months), 2018 NBFC-driven correction (recovered in ~9 months).
- Moderate corrections (15–25% falls): Typically recover within 9–18 months. Example: 2015–2016 China-driven selloff (recovered in ~12–15 months), 2022 rate hike driven fall (recovered in ~8 months).
- Major crashes (30–60% falls): Recovery takes 18 months to 3 years. The 2008 Global Financial Crisis saw Nifty fall ~60% from peak to trough and took approximately 2 years to fully recover. The COVID crash of 2020 was an exception — the Nifty fell 38% in 6 weeks but recovered within 6 months due to unprecedented global monetary stimulus.
The important insight is that Nifty 50 has never failed to recover and make new highs after any correction in its entire history. An investor who stayed fully invested through every crash since 2000 turned ₹1 lakh into approximately ₹18–20 lakhs by 2024 — a 18–20× return over 24 years, equating to roughly 12–13% annual CAGR, comfortably beating inflation, gold, and fixed deposits over the same period.
For SIP investors specifically, recovery time matters less than for lump sum investors, because the units accumulated during the downturn automatically benefit from the eventual recovery — often making the recovery phase the period of highest portfolio return acceleration.
India's economy has a uniquely high sensitivity to crude oil prices because India imports approximately 85% of its total crude oil requirement, making it the world's third-largest oil importer. When global crude oil prices rise sharply, the impact flows through the Indian economy — and therefore the stock market — through multiple channels simultaneously:
- Import bill and CAD expansion: A $10/barrel rise in crude prices increases India's annual oil import bill by approximately $12–15 billion (₹1,00,000 crore), which widens the Current Account Deficit (CAD). A widening CAD weakens the rupee, which in turn makes all other imports more expensive — creating an inflationary spiral.
- Corporate margin compression: Sectors like aviation, logistics, chemicals, paints, FMCG, and manufacturing face direct input cost inflation. When raw material costs rise faster than companies can raise prices, profit margins compress — and lower earnings mean lower stock valuations.
- Inflation spike and RBI response: Higher oil prices directly feed into India's Consumer Price Index (CPI) through fuel, transportation, and food prices. If CPI rises above the RBI's comfort zone (currently 4% ± 2%), the RBI is forced to raise interest rates. Higher rates increase borrowing costs for businesses, reduce consumer spending, slow GDP growth, and compress Price-to-Earnings (PE) ratios in equity markets.
- Government fiscal pressure: If the government absorbs part of the oil price rise to protect consumers (by not raising fuel prices), the fiscal deficit widens. This reduces the government's capacity for growth-oriented spending like infrastructure, which impacts forward earnings expectations for many sectors.
- FII sentiment deterioration: Foreign investors closely monitor India's macro indicators. A widening CAD, weakening rupee, and rising inflation are all signals that prompt FIIs to reduce their India exposure — which directly sells down equity indices.
In short, for India, a sustained $20/barrel spike in crude oil acts like a simultaneous tax on every sector of the economy — which is why the relationship between crude oil spikes and Nifty corrections has been so consistent historically.
The honest answer is: nobody can know for certain whether today is the exact bottom. The market could fall further before recovering. What data and history tell us, however, is that investing during sharp corrections generates significantly better long-term returns than investing at market peaks — even if the bottom hasn't been reached yet.
The strategy that financial planners consistently recommend for lump sum deployment during volatile markets is called Systematic Transfer Plan (STP) or Staggered Deployment:
- Park the lump sum amount in a Liquid Fund or Short-Duration Debt Fund immediately
- Set up an automatic STP to transfer a fixed amount from the liquid fund into your chosen equity fund every week or fortnight
- This way, if markets fall further, you continue buying at lower prices. If markets recover, you've still deployed at good valuations
- Spread the full deployment over 3–6 months rather than investing everything on a single day
For investors with a 5+ year investment horizon, valuations after a 10–15% correction are historically attractive entry points. Long-term data from AMFI and CRISIL consistently shows that lump sum investments made during Nifty correction phases (10–20% below peak) generated average 5-year returns of 14–18% CAGR — significantly above the market's long-term average of 12–13%.
However, if you're investing for a goal within the next 1–2 years (a house purchase, education, wedding), this is not the time to deploy in equities — regardless of valuations. Short-term goals require capital protection, not equity returns. Use Fixed Deposits or Debt Funds for such goals.
While predicting market crashes with precision is impossible, there are specific indicators that have historically preceded — or accompanied — major market crashes in India and globally. Watching these indicators can help you assess whether a correction is deepening into something more serious:
- Banking system stress: Rising Non-Performing Assets (NPAs), tightening of interbank lending, or a major NBFC failure (like the IL&FS crisis of 2018) are serious red flags. India's current banking system health is strong — NPAs are near decade lows.
- Sustained Nifty break below 200-DMA: A decisive, sustained break below the 200-Day Moving Average on high volumes is the most important technical signal that a correction may deepen into a bear market.
- Corporate earnings downgrade cycle: When multiple large companies begin missing earnings estimates and downgrading forward guidance simultaneously, it signals that fundamentals are deteriorating — not just sentiment.
- Credit market seizure: When credit spreads (the difference in yield between corporate bonds and government bonds) widen dramatically, it means bond markets are pricing in elevated default risk — a classic pre-crash signal.
- Retail investor panic redemptions: When mutual fund SIP pause/stop requests spike (AMFI publishes this data monthly), it indicates retail capitulation — which historically marks bottoms, not further declines.
- Currency collapse: A rupee weakening beyond ₹90–95/USD would signal a full-blown external payments crisis — far beyond current levels.
Currently, none of these critical crash indicators are flashing red. The correction is being driven by external sentiment factors, not domestic structural weakness. This is why most credible analysts classify the current situation as a painful but manageable correction rather than the beginning of a multi-year bear market for Indian equities.
Different mutual fund categories have very different risk profiles during market crashes, and understanding these differences can help you make smarter allocation decisions during volatile periods:
- Large Cap & Index Funds: Nifty 50 or Sensex index funds are the most resilient equity category during crashes because they're diversified across 50 large, fundamentally strong companies. They fall less than mid/small caps and recover faster. Best for: conservative to moderate equity investors.
- Balanced Advantage Funds (BAF) / Dynamic Asset Allocation: These funds automatically reduce equity exposure when markets are overvalued and increase it during corrections. They typically fall 30–40% less than pure equity funds during crashes. Best for: first-time investors and risk-averse investors seeking equity growth with lower volatility.
- Multi-Asset Funds: Invest across equity, debt, and gold simultaneously. Gold tends to rise during equity sell-offs, providing a natural hedge. Best for: investors who want diversification within a single fund.
- Flexi Cap / Multi-Cap Funds: Give fund managers the flexibility to shift between large, mid, and small caps based on opportunities. During crashes, quality flexi-cap funds tend to shift toward defensives automatically. Best for: medium-risk investors with 5+ year horizon.
- Liquid Funds & Ultra Short Duration: For capital you'll need within 6–12 months, these provide safety during market turbulence with returns slightly above savings accounts. Best for: parking emergency funds or short-term goals.
Categories to be cautious about during crashes include sectoral and thematic funds (concentrated risk), small cap funds (highest volatility, slowest recovery), and credit risk funds (corporate bond default risk increases during economic stress). These categories require longer holding periods and higher risk tolerance — crashes can amplify their downside significantly.
Stock Market Crash Today: Important Resources for Investors
The ongoing stock market crash today has created uncertainty among investors across India. As Sensex and Nifty continue to witness volatility, many investors are searching for reliable information to understand the reasons behind the stock market crash today and its impact on their investment portfolios.
Whether you are a beginner or an experienced investor, staying informed during a stock market crash today is essential. Factors such as rising crude oil prices, geopolitical tensions, inflation concerns, foreign institutional investor selling, and global economic uncertainty have all contributed to the recent stock market crash today.
Understanding these developments can help investors make rational decisions instead of reacting emotionally to market fluctuations. Many investors are wondering whether the stock market crash today represents a temporary correction or the beginning of a larger market downturn.
Experts believe the stock market crash today is being influenced by a combination of domestic and global economic factors. The stock market crash today has increased volatility across major sectors including banking, IT, manufacturing, energy, and financial services.
To help you navigate the stock market crash today, we have compiled trusted resources, stock market learning guides, regulatory websites, and live market tracking platforms. These resources can help investors understand the causes behind the stock market crash today, monitor market movements, and identify long-term investment opportunities.
Long-term investors often view a stock market crash today as an opportunity to accumulate quality stocks at attractive valuations. Understanding the causes behind the stock market crash today can help investors make better financial decisions and remain focused on their long-term wealth creation goals.
Useful Resources for Investors
Explore trusted financial resources, stock market education, live market data, regulatory updates, and investment learning platforms.
Mint & Print Resources
Market Data & Exchanges
Investor Knowledge Hub
Disclaimer: The stock market crash today and market volatility can impact investment returns. Investors should conduct their own research and consult qualified financial advisors before making investment decisions.


Post Comment