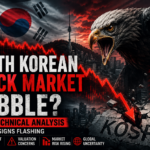
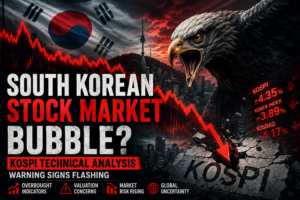
Is the South Korean Stock Market Entering Bubble Territory? Technical Warning Signs Investors Should Watch
The KOSPI has delivered an impressive rally over the past several years, attracting both domestic and international investors seeking exposure to Asia's advanced manufacturing, semiconductor, technology, and export-driven economy.
However, history reminds investors that every powerful bull market eventually faces a reality check. Today, several technical indicators, valuation metrics, and sentiment measures suggest that portions of the South Korean Stock Market may be approaching conditions that have historically preceded major market corrections.
This analysis examines the current state of the South Korean Index, evaluates the technical structure of the KOSPI Stock Market, and explores whether investors should prepare for increased volatility in the months ahead.
Understanding the South Korean Stock Market Rally
The KOSPI has benefited from strong technology exports, AI-driven semiconductor demand, improving corporate governance initiatives, and significant foreign institutional participation.
The benchmark South Korean Index, represented primarily by the KOSPI, has witnessed substantial gains as investors priced in improving earnings expectations and a favorable macroeconomic outlook.
While bullish momentum remains strong, technical analysts often become cautious when market advances begin to outpace underlying fundamentals.
| Bullish Factors |
Potential Risks |
| AI & Semiconductor Growth |
Overextended Valuations |
| Foreign Capital Inflows |
Extreme Investor Optimism |
| Government Reforms |
Technical Overbought Conditions |
| Strong Corporate Earnings |
Global Economic Slowdown Risk |
Technical Analysis of KOSPI
From a technical perspective, the current structure of the South Korean Index displays several characteristics commonly observed near major market tops.
1. RSI Indicates Overbought Conditions
The Relative Strength Index (RSI) on long-term charts of the KOSPI Stock Market has repeatedly entered levels historically associated with overheated market conditions.
When RSI readings remain elevated for extended periods, markets often become vulnerable to sharp corrections as momentum traders begin taking profits.
Chart Suggestion:
Insert TradingView Weekly KOSPI RSI Chart Here
Highlight historical RSI peaks preceding previous corrections.
2. Price Trading Far Above Long-Term Moving Averages
A second warning sign within the KOSPI is the increasing distance between current prices and long-term moving averages.
Historically, when the South Korean Index trades significantly above its 200-week moving average, subsequent mean reversion tends to occur.
Although trends can remain strong for extended periods, excessive separation from long-term trend lines often signals increasing downside risk.
Chart Suggestion:
Insert Weekly KOSPI Chart with 50W and 200W Moving Averages.
3. Narrowing Market Breadth
Another notable concern is market breadth. In many late-stage bull markets, a smaller number of large-cap stocks drive index gains while broader participation weakens.
If fewer stocks continue supporting advances within the KOSPI Stock Market, the rally may become increasingly fragile.
Historical Comparison: Previous South Korean Index Peaks
| Period |
Key Characteristics |
Outcome |
| 2000 Tech Bubble |
Extreme Technology Optimism |
Sharp Multi-Year Correction |
| 2007 Global Expansion |
Strong Economic Growth |
Global Financial Crisis Decline |
| 2021 Liquidity Rally |
Record Liquidity & Retail Participation |
Subsequent Bear Market |
| Current Cycle |
AI Optimism & Semiconductor Boom |
Yet To Be Determined |
Could a KOSPI Bubble Burst Impact Indian Investors?
Indian investors often underestimate how interconnected global markets have become. A significant correction within the South Korean Stock Market could influence broader Asian sentiment, foreign capital flows, and risk appetite across emerging markets.
While India's structural growth story remains different, global investors frequently adjust allocations across emerging economies simultaneously during periods of market stress.
As a result, a major decline in the KOSPI Stock Market could temporarily affect investor sentiment toward other Asian markets, including India.
Technical Indicators Currently Worth Monitoring
- Weekly RSI Levels
- MACD Momentum Divergences
- Market Breadth Indicators
- Foreign Institutional Flows
- Valuation Expansion Relative To Earnings Growth
- Distance From Long-Term Moving Averages
- Volume Confirmation During New Highs
When multiple indicators begin flashing caution signals simultaneously, investors should avoid becoming excessively optimistic simply because prices continue rising.
Mint & Print Financial Studies Perspective
At Mint & Print Financial Studies, we believe investors should remain objective regardless of prevailing market narratives.
The South Korean Stock Market continues to benefit from strong structural themes, particularly semiconductor leadership and technological innovation. However, technical analysis suggests that portions of the South Korean Index may be approaching historically stretched conditions.
Whether the current environment ultimately develops into a full-scale KOSPI bubble burst remains uncertain. What is clear, however, is that risk-reward dynamics appear less attractive than they were earlier in the cycle.
Investors should focus on disciplined risk management, valuation awareness, and long-term portfolio construction rather than chasing momentum-driven rallies.
Final Thoughts
The South Korean Stock Market remains one of Asia's most important financial markets, and the South Korean Index continues reflecting the strength of the country's globally competitive industries.
Yet history repeatedly demonstrates that even the strongest bull markets eventually experience periods of correction. Technical indicators currently suggest elevated optimism, stretched momentum, and growing vulnerability within segments of the KOSPI Stock Market.
For investors, the key question is not whether markets can continue rising—but whether the potential reward adequately compensates for the increasing risks visible on long-term technical charts.
Disclaimer: This article is intended solely for financial education and market analysis purposes. It does not constitute investment advice, a recommendation, or a forecast of future market performance. Investors should conduct independent research and consult qualified financial professionals before making investment decisions.


Post Comment