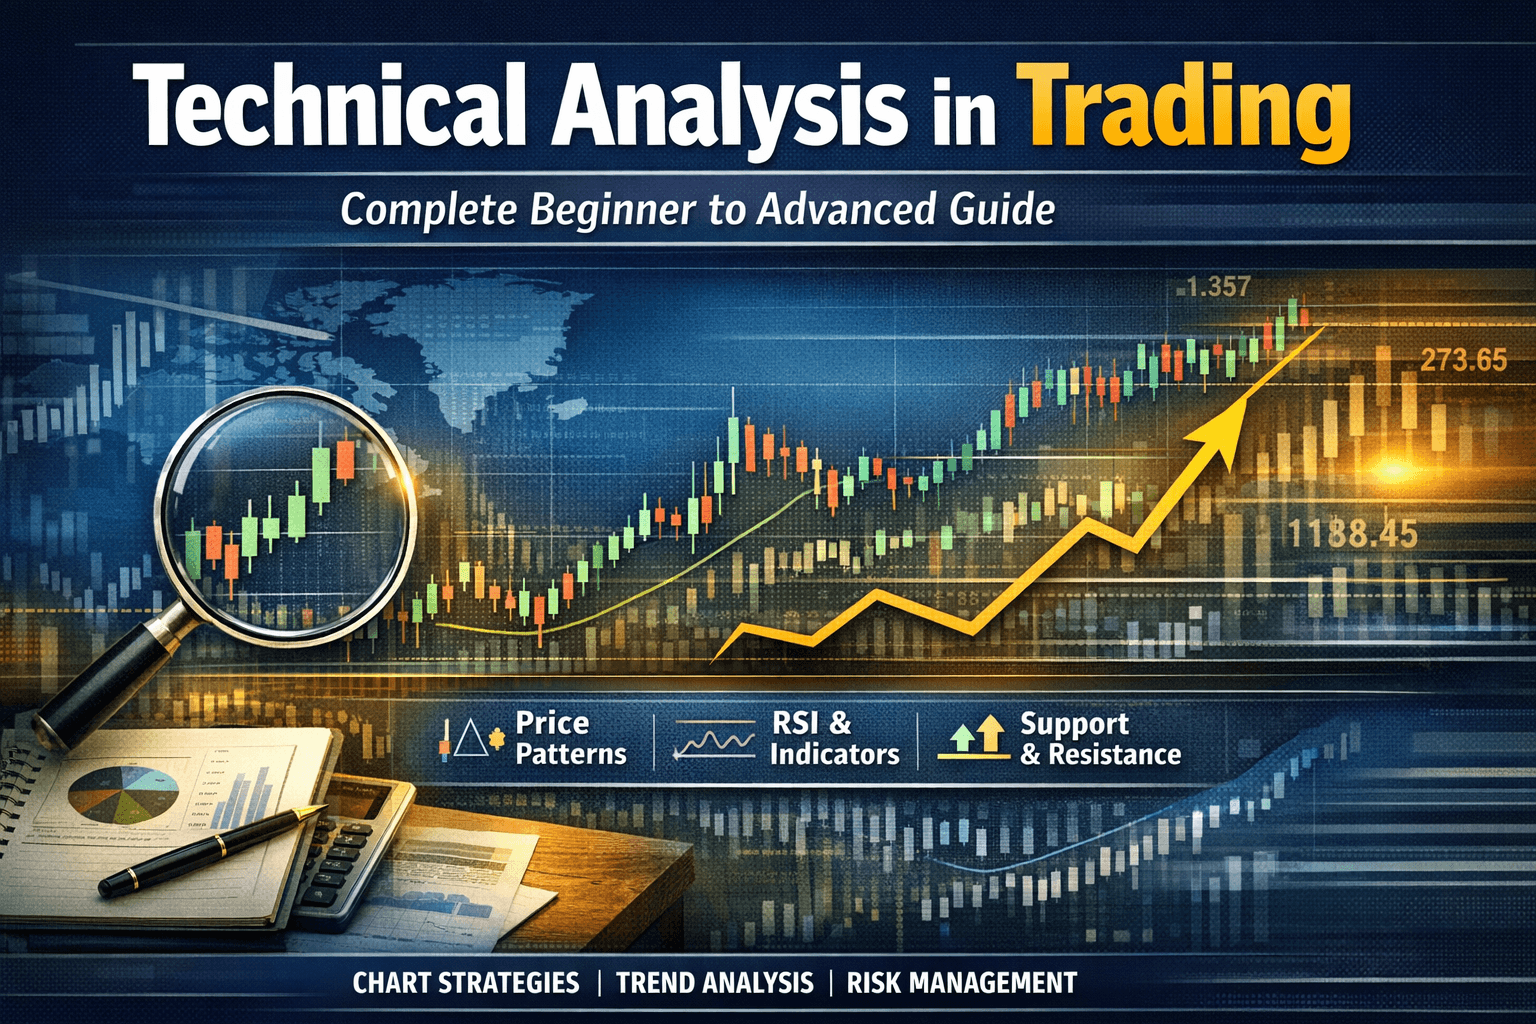
Technical analysis in trading forms the foundation of structured decision-making in financial markets. In an environment driven by price fluctuations, sentiment shifts, and global economic signals, traders who rely on clear frameworks tend to perform more consistently than those who act on impulse.
Understanding how technical analysis works is not about predicting the future with certainty—it is about interpreting price behavior, identifying patterns, and making informed decisions based on probability.
What is Technical Analysis in Trading?
Technical analysis in trading is the study of historical price movements to evaluate future market behavior. Instead of focusing on company fundamentals or macroeconomic narratives alone, it emphasizes price action, trends, and patterns.
At its core, technical analysis operates on three key principles:
- Price discounts everything – All available information is already reflected in price
- Markets move in trends – Trends persist until a clear reversal occurs
- History tends to repeat itself – Patterns emerge due to consistent human behavior
These principles make technical analysis universally applicable across equities, forex, commodities, and even cryptocurrencies.
Benefits of Technical Analysis in Trading & Why Technical Analysis Matters in Modern Markets
Global financial markets are increasingly interconnected. A shift in interest rates in the United States can influence equity markets in India, while commodity price movements can impact emerging economies.
In such a dynamic environment, technical analysis provides:
- Clarity in decision-making
- Structured entry and exit strategies
- Risk management frameworks
Unlike opinion-driven trading, it focuses on what the market is doing, not what it “should” do.
Core Components of Technical Analysis
1. Price Action: The Language of the Market
Price action represents the raw movement of price over time. It reflects the interaction between buyers and sellers and forms the basis of all technical analysis.
Key observations include:
- Higher highs and higher lows (uptrend)
- Lower highs and lower lows (downtrend)
- Sideways movement (range-bound market)
Understanding price action eliminates dependency on excessive indicators and helps traders interpret market structure directly.
2. Support and Resistance: Key Decision Zones
Support and resistance levels are critical areas where price tends to react.
- Support: A level where buying interest emerges
- Resistance: A level where selling pressure increases
These zones are not exact lines but areas of interest.
A key insight:
Repeated testing of a level often weakens it, increasing the probability of a breakout.
This concept is essential for planning entries, exits, and stop-loss placement.
3. Trend Analysis: Following Market Direction
Trend analysis helps traders align with the broader market direction.
Types of trends:
- Uptrend
- Downtrend
- Sideways trend
Trading with the trend improves probability, while trading against it increases risk.
Common tools include:
- Trendlines
- Moving averages
- Price structure analysis
4. Technical Indicators: Supporting Tools, Not Decision Makers
Technical indicators help refine analysis but should not replace price understanding.
Popular indicators include:
- RSI (Relative Strength Index) – Measures momentum
- MACD – Identifies trend strength and reversals
- Moving Averages – Smooth price data
The key is not to overload charts but to use 2–3 complementary indicators effectively.
5. Volume Analysis: Confirming Market Strength
Volume reflects participation behind price movement.
- Rising price + high volume → strong trend
- Rising price + low volume → weak trend
Volume often acts as a confirmation tool, especially during breakouts.
How Technical Analysis Works in Real Market Conditions
Consider a practical scenario:
A stock approaches a resistance level multiple times but fails to break it. Over time, buying pressure builds, and the level weakens. When price finally breaks above resistance with strong volume, it often leads to a sustained upward move.
This is not prediction—it is probability based on observed behavior.
Common Mistakes in Technical Analysis
Even with the right tools, many traders struggle due to execution errors.
1. Indicator Overload
Using too many indicators creates confusion rather than clarity.
2. Ignoring Market Structure
Indicators without understanding price structure can lead to false signals.
3. Emotional Decision-Making
Fear and greed often override structured analysis.
4. Lack of Discipline
Failing to follow a predefined plan reduces consistency.
From Understanding to Execution
One of the biggest challenges in trading is transitioning from knowledge to execution.
Effective technical analysis requires:
- A clear trading plan
- Defined entry and exit rules
- Risk management strategy
- Consistency over time
The process can be simplified into:
Analyze → Plan → Execute → Review
Over time, this structured approach leads to improved decision-making.
Global Perspective: Why Technical Analysis Works Everywhere
Whether you are analyzing Indian equities or US markets like the S&P 500, the principles of technical analysis remain consistent.
This is because:
- Market behavior is driven by human psychology
- Supply and demand dynamics are universal
- Price patterns repeat across asset classes
This makes technical analysis a powerful tool for traders operating in India, USA, and global markets.
Strategic Insight: Clarity Over Complexity
The real edge in trading does not come from complex strategies—it comes from clarity.
A trader who:
- Understands price behavior
- Follows structured rules
- Manages risk effectively
is more likely to succeed than someone relying on predictions or shortcuts.
Read this Article with –
External Reference Suggestion
For macroeconomic context, refer to global economic insights from institutions such as the World Bank or IMF.( click here )
Conclusion
Technical analysis in trading is not about forecasting markets with certainty—it is about building a structured framework for decision-making.
By focusing on:
- Price action
- Market structure
- Trend behavior
- Risk management
traders can move from reactive decisions to strategic execution.
In an increasingly complex financial environment, the ability to observe clearly and act with discipline becomes a significant advantage.
Frequently Asked Questions (FAQs)
1. Is technical analysis reliable for beginners?
Yes, when applied with discipline and a structured approach, it provides a strong foundation for understanding markets.
2. Can technical analysis predict market movements?
No, it does not predict—it helps identify probabilities based on historical patterns.
3. How many indicators should a trader use?
Ideally 2–3 indicators, combined with price action, are sufficient.
Final Note
If you want structured, research-driven insights on markets, trading, and global economic trends, consider subscribing for regular updates.
Disclaimer:
This content is for educational purposes only and does not constitute investment advice.


Post Comment