Introduction-52-Week Low Stocks: What They Really Indicate
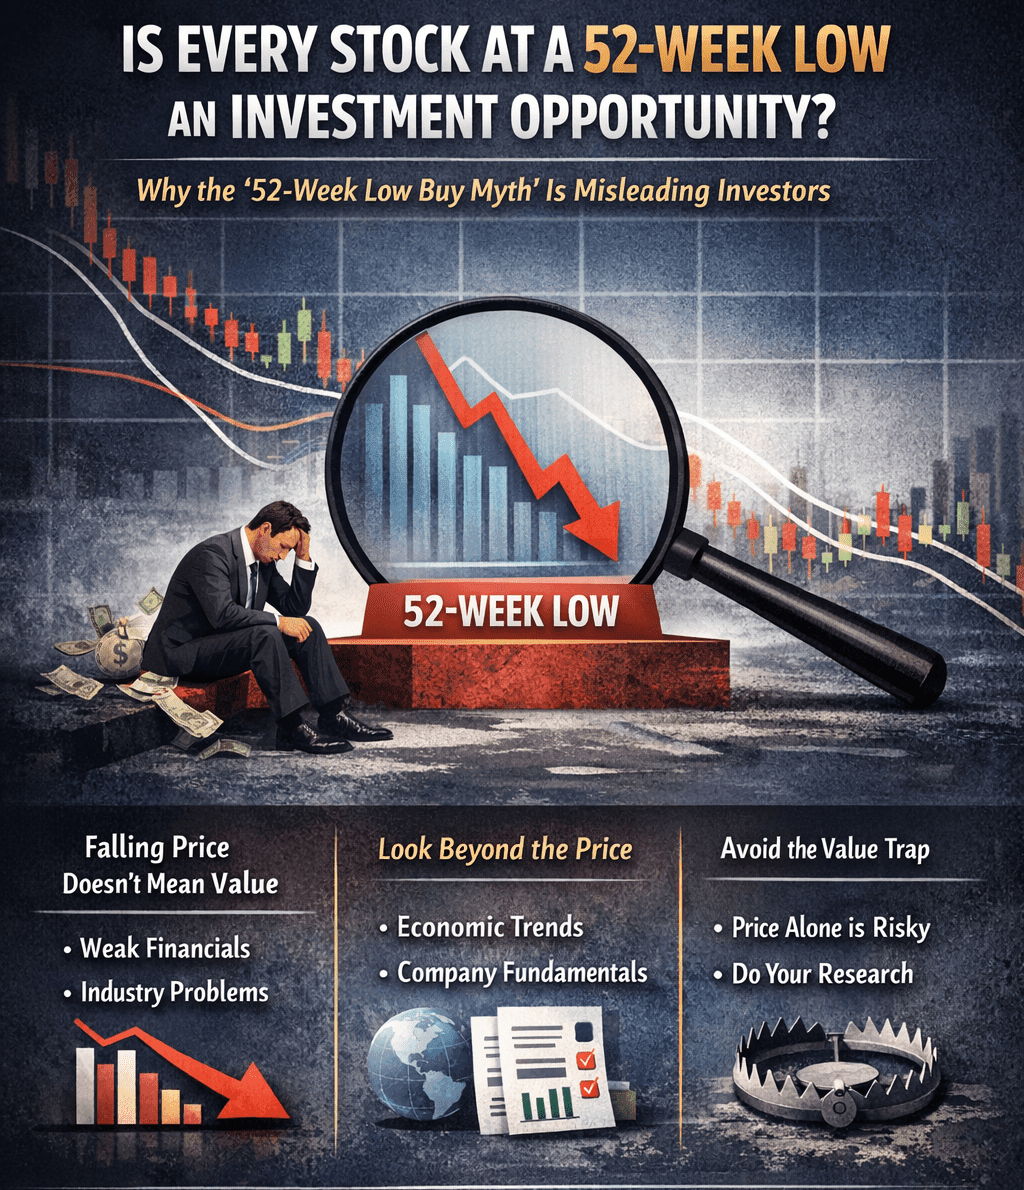
52-week low stocks often attract investors who believe lower prices mean better opportunities. However, not every stock at a 52-week low represents value, and understanding the difference between price and strength is essential.
However, this belief can be misleading.
In reality, a stock at a 52-week low is not necessarily cheap—it is simply trading at a lower price compared to its past performance. Understanding the difference between price and value is essential for making informed investment decisions.
What Does a 52-Week Low Actually Indicate?
A 52-week low represents the lowest price at which a stock has traded over the past 12 months.
It does not indicate:
- Whether the company is fundamentally strong
- Whether earnings are improving or declining
- Whether the industry is growing or weakening
It reflects only one thing—price movement, not business quality.
Why Do Stocks Fall to 52-Week Lows?
Stocks rarely decline without underlying reasons. Persistent downward movement is typically driven by a combination of factors.
1. Weak Financial Performance
Declining revenue, shrinking margins, or inconsistent earnings can reduce investor confidence and push prices lower.
2. Macroeconomic Pressures
Rising interest rates, inflation, or global slowdowns often impact entire sectors, regardless of individual company strength.
3. Industry-Specific Challenges
Changes in regulation, technological disruption, or shifting demand patterns can weaken even established businesses.
4. Institutional Selling
When large investors exit positions, prices often reflect this shift quickly, leading to sustained downward trends.
The Critical Distinction: Cheap vs Value
A stock falling from ₹500 to ₹100 may appear inexpensive—but that does not automatically make it a good investment.
It may still be:
- Overvalued relative to earnings
- Facing structural challenges
- Losing competitive advantage
This situation is commonly referred to as a value trap—a stock that appears cheap but continues to decline.
What Technical Analysis Reveals
From a technical perspective, stocks at 52-week lows typically exhibit clear signs of weakness.
Common Technical Characteristics
- Sustained downtrend (lower highs and lower lows)
- Trading below key moving averages
- Weak momentum and lack of buying interest
These patterns suggest that the market is still pricing in negative expectations.
Markets generally favor stocks showing stability or upward momentum, rather than those continuing to decline.
The Role of Macro and Micro Analysis
Evaluating a stock requires looking beyond price levels and considering both broader and company-specific factors.
Macro Perspective
Assess the overall economic environment:
- Interest rate trends
- Inflation levels
- Economic growth outlook
An unfavorable macro environment can suppress even fundamentally strong companies.
Micro Perspective
Analyze the company’s fundamentals:
- Revenue growth
- Profitability
- Debt levels
- Cash flow consistency
A stock becomes a potential opportunity only when its business fundamentals support its valuation.
Why Investors Fall into the 52-Week Low Trap
The attraction to 52-week low stocks is often psychological.
Common assumptions include:
- “It cannot fall further”
- “It is already at the bottom”
- “It will eventually recover”
However, markets do not operate on assumptions. Stocks can remain under pressure for extended periods, and some may never return to previous highs.
When Can a 52-Week Low Stock Be a Valid Opportunity?
A stock at a 52-week low may be worth considering—but only under specific conditions.
Key Signals to Look For
- Improvement in financial performance
- Stabilization of price after prolonged decline
- Early signs of trend reversal
- Recovery in the broader sector
Without these confirmations, buying at lows becomes speculative rather than strategic.
A More Disciplined Investment Approach
Instead of focusing solely on price, a structured approach provides better clarity.
1. Identify Market Trend
Determine whether the stock is still in a downtrend or showing signs of reversal.
2. Evaluate Fundamentals
Assess financial strength and long-term viability of the business.
3. Understand Market Context
Consider macroeconomic conditions and sector dynamics.
4. Wait for Confirmation
Avoid premature entry—wait for clear signals of stability or recovery.
This approach aligns with disciplined investing and reduces the risk of falling into value traps.
Key Takeaway
Not every 52-week low stock represents an opportunity.
A declining price is not an invitation to buy—it is a signal to investigate.
Successful investing is not about chasing low prices, but about identifying:
- Strength over weakness
- Structure over randomness
- Value over perception
Conclusion
The idea that every 52-week low stock is a buying opportunity is an oversimplification that can lead to costly mistakes.
Markets reward clarity, discipline, and informed decision-making—not assumptions based on price alone.
By combining:
- Technical analysis
- Fundamental evaluation
- Macro awareness
investors can move beyond superficial signals and develop a more structured approach to identifying real opportunities.
Disclaimer
This content is for educational purposes only and does not constitute investment advice.


Post Comment