Why the PE Ratio Matters in Modern Markets
Markets are forward-looking. Investors do not buy the past; they buy expectations about the future. As a result, two companies with similar profits can trade at very different valuations depending on growth prospects, competitive advantage, management quality, and macroeconomic conditions.
The PE ratio meaning is important because it translates these expectations into a measurable number.
A company trading at a PE of 30 means investors are willing to pay 30 times its annual earnings. A company trading at a PE of 10 implies a lower valuation relative to earnings.
That does not automatically mean one is expensive and the other is cheap. It means expectations differ.
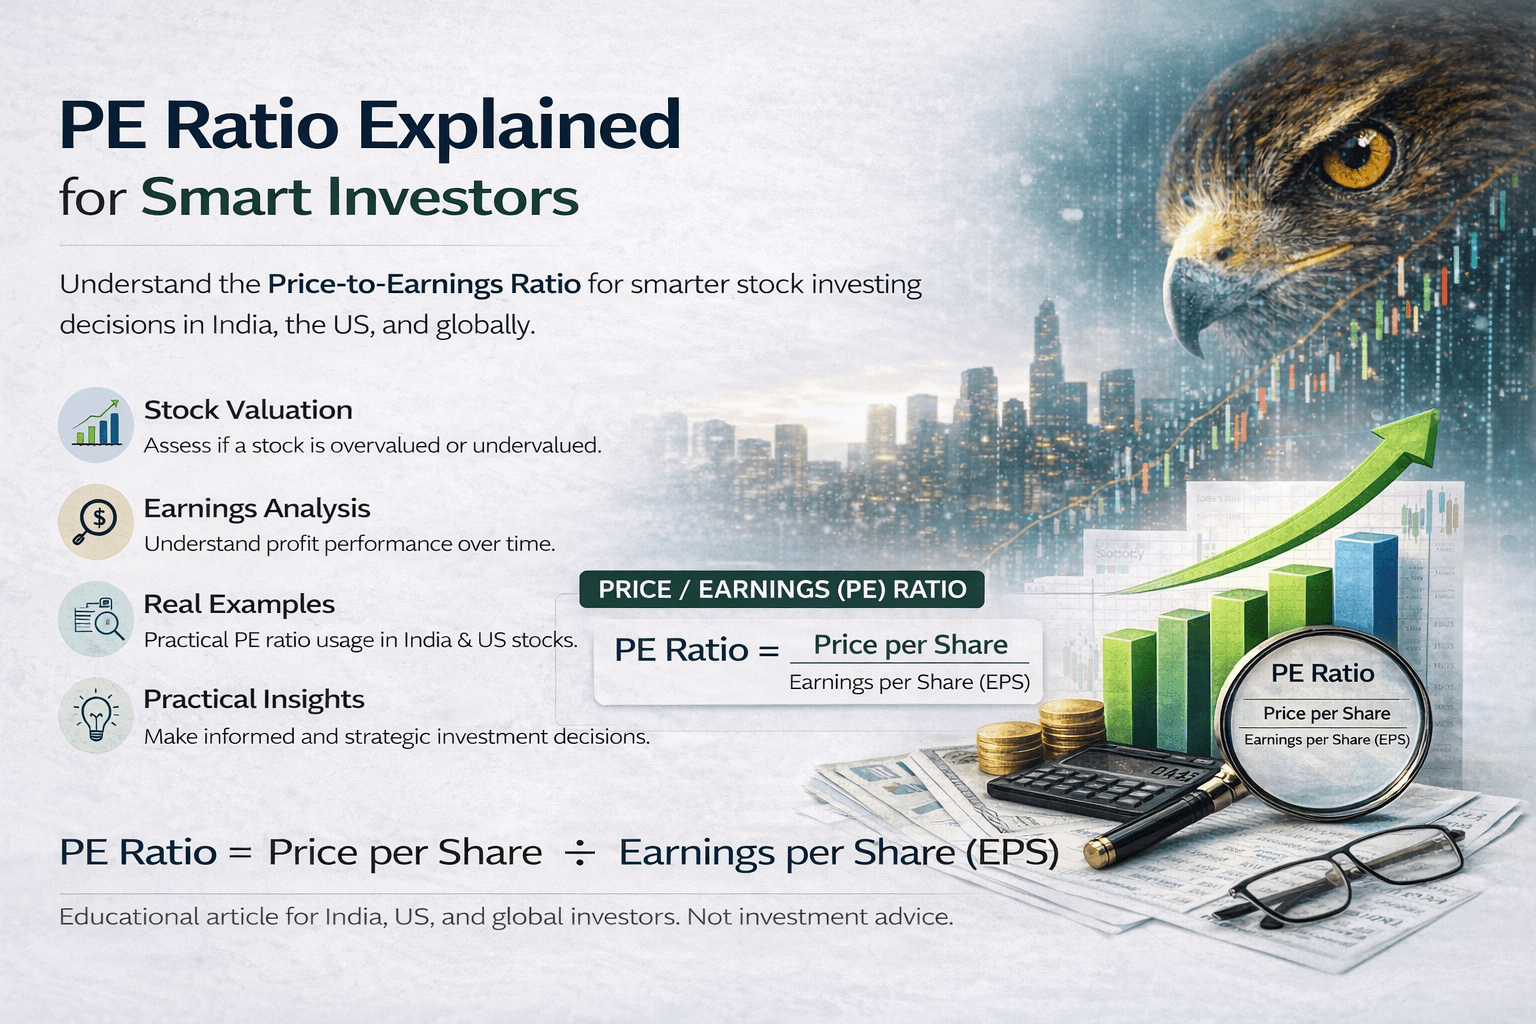
What is the PE Ratio?
The PE ratio stands for:
If a company’s stock price is ₹1,000 and its earnings per share are ₹50:
This means investors are paying ₹20 for every ₹1 of earnings.
Understanding the PE ratio meaning requires looking beyond the formula. It is not just arithmetic—it reflects confidence, risk perception, and future growth expectations.
Types of PE Ratio Investors Should Know
1. Trailing PE
This uses earnings from the last 12 months.
- Based on reported results
- More factual and historical
- Useful for stable companies
2. Forward PE
This uses projected earnings for the next 12 months.
- Reflects future expectations
- Commonly used in growth sectors
- Depends on analyst forecasts
A stock may look expensive on trailing PE but reasonable on forward PE if earnings are expected to rise sharply.
PE Ratio Meaning Through Real Examples
Example 1: Mature Consumer Company
A large consumer goods company may trade at PE 40 because:
- Earnings are consistent
- Brand strength is high
- Cash flows are stable
- Investors trust long-term resilience
Example 2: Cyclical Metal Company
A steel producer may trade at PE 8 because:
- Earnings fluctuate with commodity cycles
- Demand depends on economic growth
- Margins can compress quickly
Example 3: Technology Growth Stock
A software company may trade at PE 55 if markets expect:
- Rapid revenue expansion
- High scalability
- Future margin growth
These examples show that PE ratio meaning depends on business quality and future potential, not just the number itself.
How to Use PE Ratio for Stock Valuation
The PE ratio is most useful when used comparatively.
1. Compare with Industry Peers
A bank should be compared with banks, not with technology firms. Sector dynamics matter.
2. Compare with Historical Average
If a company usually trades at PE 18 but now trades at PE 28, investors should ask why.
3. Compare with Growth Rate
Higher growth can justify a higher PE. Low growth with a very high PE may signal overvaluation risk.
4. Compare with Interest Rate Environment
When interest rates are low, markets often assign higher valuations. Rising rates can compress PE multiples globally.
Global Perspective: India, USA, and International Markets
The PE ratio meaning also varies across regions.
India
Indian markets often command premium valuations because of:
- Strong domestic growth expectations
- Expanding middle class consumption
- Long-term structural optimism
United States
US markets, especially large technology companies, may trade at higher PE levels due to:
- Innovation leadership
- Global market share
- High operating leverage
Developed Europe / Japan
Valuations can be lower where growth is slower or demographic challenges weigh on expectations.
This is why comparing PE ratios across countries without context can be misleading.
When a High PE Ratio is Reasonable
Many investors assume a high PE always means overvaluation. That is incomplete thinking.
A high PE can be justified when a company has:
- Strong earnings growth visibility
- Pricing power
- Low debt
- Durable competitive moat
- High return on capital
For example, premium consumer brands or dominant software platforms often sustain elevated valuations for years.
When a Low PE Ratio is Dangerous
Likewise, a low PE does not automatically mean a bargain.
Sometimes a stock trades cheaply because markets expect:
- Earnings decline
- Regulatory risk
- Weak management execution
- High debt stress
- Structural disruption
This is where investors fall into value traps.
A company trading at PE 6 may still become cheaper if profits collapse next year.
PE Ratio Meaning and Earnings Analysis
The denominator in the PE formula is earnings. If earnings quality is weak, the PE ratio becomes less useful.
Smart investors combine earnings analysis with valuation by examining:
- Revenue growth consistency
- Margin trends
- Free cash flow generation
- One-time gains or losses
- Debt burden
A stock with strong accounting profits but weak cash flows deserves caution.
Common Mistakes Investors Make with PE Ratio
1. Using PE in Isolation
No single metric should drive investment decisions.
2. Comparing Different Sectors
Comparing a bank’s PE with a software company’s PE can distort judgment.
3. Ignoring Growth
A PE of 35 may be reasonable for 25% earnings growth, but excessive for 5% growth.
4. Ignoring Cycles
Commodity companies often look cheapest near peak earnings and most expensive near trough earnings.
5. Assuming Low PE Means Safety
Cheap stocks can stay cheap for valid reasons.
Strategic Insight: Combine PE with Other Metrics
The best investors use PE ratio as one part of a broader framework.
Combine it with:
- Price to Book for banks and financials
- EV/EBITDA for capital-intensive sectors
- ROE / ROCE for business quality
- Debt to Equity for balance-sheet strength
- Technical trend analysis for timing entries
This turns simple valuation into structured investing.
How Long-Term Investors Can Use PE Ratio Meaning Wisely
For long-term portfolios:
Use PE to Avoid Excessive Overpaying
Even great businesses can deliver poor returns if bought at irrational valuations.
Use PE During Corrections
Market declines often compress PE multiples and create better entry points.
Use PE with Patience
Valuation opportunities reward disciplined investors more than reactive traders.
Internal Linking Suggestions
To strengthen topical relevance on your website, internally link this article to:
Conclusion
Understanding the PE ratio meaning is not about memorizing one formula. It is about interpreting how markets price earnings, growth, risk, and future expectations.
A high PE ratio may indicate quality or optimism. A low PE ratio may signal opportunity or danger. The difference lies in business fundamentals and market context.
For smart investors, the PE ratio is most powerful when paired with stock valuation discipline, earnings analysis, and long-term thinking.
Price tells you what the market is charging. PE helps explain why.
Frequently Asked Questions
1. What is a good PE ratio for investing?
There is no universal good PE ratio. It depends on sector, growth rate, and market conditions.
2. Is a low PE ratio always better?
No. A low PE may indicate undervaluation or serious business risks.
3. Should beginners use PE ratio?
Yes. It is one of the easiest and most useful starting tools in stock valuation when used with context.
Final Note
If you want structured financial insights, subscribe for regular updates.
Clear investing decisions begin with clear frameworks.
Understanding valuation is often the first edge investors develop.
Disclaimer: This content is for educational purposes only and does not constitute investment advice.


Post Comment