Introduction-Market Crash Analysis: Key Technical Patterns to Watch
Market crash analysis helps traders understand how financial markets behave during extreme volatility. Using technical analysis, traders can identify early warning signals such as trend reversals, support breakdowns, and volume expansion.
In reality, market crashes are rarely random events. They are typically preceded by structural weaknesses, momentum shifts, and breakdowns in key price levels. For traders and investors, the objective is not to predict the exact timing of a crash, but to recognize early warning signals through price action, volume analysis, and trend behavior.
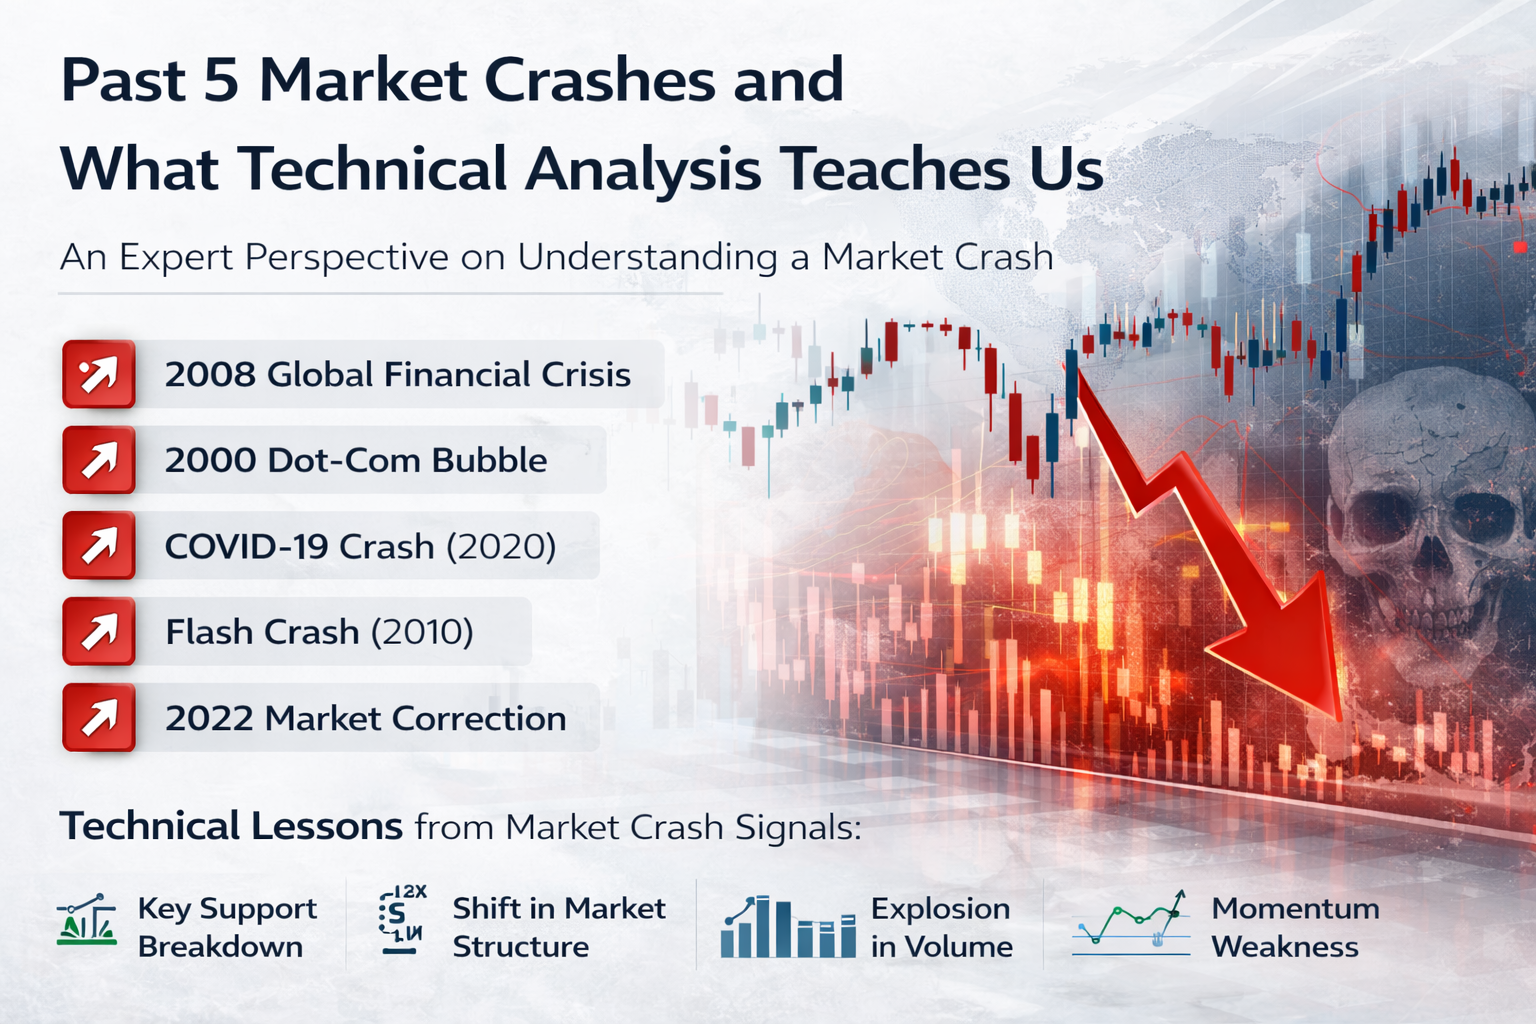
This article presents a structured market crash analysis of five major historical events, highlighting key technical lessons that remain relevant across global markets.
Why Market Crash Analysis Matters-
Understanding past market crashes helps traders:
- Identify recurring technical patterns
- Recognize early signs of trend reversal
- Improve risk management strategies
- Avoid emotional decision-making
Historical observations show that most major crashes are preceded by distribution phases, weakening momentum, and repeated failures at key levels.
1. The 2008 Global Financial Crisis
Technical Setup Before the Crash
- Formation of consistent lower highs
- Repeated testing of critical support zones
- Gradual loss of bullish momentum
Technical Signals Observed
- Breakdown below long-term support levels
- Moving averages turning downward
- Increase in volatility and wider price ranges
Key Lesson
Repeated testing of support weakens its strength. Once a major support level fails, it often leads to accelerated selling and trend reversal.
2. The Dot-Com Bubble Crash (2000)
Technical Setup
- Parabolic rise in technology stocks
- Significant deviation from moving averages
- Lack of structured consolidation
Technical Signals
- RSI divergence indicating weakening momentum
- Failure to sustain breakout levels
- Sharp rejection from peak levels
Key Lesson
Parabolic price movements are inherently unstable. When markets rise rapidly without consolidation, they often result in sharp and aggressive corrections.
3. The COVID-19 Market Crash (2020)
Technical Setup
- Strong bullish trend prior to the decline
- Sudden global shift in market sentiment
Technical Signals
- High-volume breakdown across global indices
- Sequential breakdown of short-term and long-term support
- Bearish moving average crossovers
Key Lesson
Volume plays a critical role in confirming market direction. A high-volume breakdown signals institutional selling and panic-driven movement, often accelerating declines.
4. The Flash Crash (2010)
Technical Setup
- Market operating within a relatively stable trend
- Sudden liquidity imbalance
Technical Signals
- Extremely rapid price decline
- Absence of nearby support levels
- Immediate recovery after sharp drop
Key Lesson
Liquidity gaps can lead to extreme volatility. Unlike structured crashes, flash crashes are driven by temporary imbalances rather than long-term structural weakness.
5. The 2022 Global Market Correction
Technical Setup
- Extended bullish cycle following 2020 recovery
- Formation of distribution zones near market highs
Technical Signals
- Sideways consolidation with lower highs
- Weak momentum within range-bound movement
- Breakdown from consolidation zones
Key Lesson
Distribution phases often precede major corrections. When price consolidates at highs with weakening momentum, it indicates institutional exit and potential trend reversal.
Common Technical Patterns Across Market Crashes
Despite differences in triggers, every market crash shares key technical characteristics.
1. Breakdown of Support Levels
Support zones represent demand. Once broken, they often turn into resistance, reinforcing bearish trends.
2. Shift in Market Structure
- Transition from higher highs to lower highs
- Clear shift from bullish to bearish trend
3. Increased Volatility
Market crashes are always accompanied by:
- Large price swings
- Rapid movement
- Expanded trading ranges
4. Momentum Weakness Before Decline
Indicators such as RSI and MACD frequently show:
- Divergence
- Loss of upward strength
5. Volume Expansion
High trading volume confirms:
- Strong selling pressure
- Institutional participation
Early Warning Signals of a Market Crash
Technical analysis does not predict crashes with certainty, but it highlights risk zones and potential weakness.
Key warning signs include:
- Repeated failure at resistance levels
- Weak or false breakouts
- Formation of lower highs
- Breakdown from consolidation patterns
- Rising volatility without directional clarity
These signals often appear before major declines and provide valuable insights for traders.
Common Mistakes During Market Crashes
1. Ignoring Trend Reversal
Holding a bullish bias despite clear structural changes leads to poor decision-making.
2. Buying Every Dip
In bearish markets, not every decline is a buying opportunity. Downtrends often continue longer than expected.
3. Overlooking Volume Confirmation
Price movements without volume support can be misleading and unreliable.
4. Emotional Decision-Making
Fear and panic often result in impulsive actions, reducing trading effectiveness.
Technical Strategy During a Market Crash
A structured approach is essential during high-volatility periods.
1. Identify Market Trend
Confirm whether the market has transitioned into a bearish structure.
2. Mark Key Levels
Broken support levels often act as resistance during pullbacks.
3. Wait for Pullbacks
Avoid chasing price. Structured entries during retracements improve risk-reward ratios.
4. Focus on Risk Management
Use stop-loss levels and position sizing to control downside risk.
This approach aligns with technical analysis and strategy execution in trading, emphasizing structure over reaction.
The Broader Perspective
A market crash is not merely a price decline—it is a transition phase in market cycles.
It reflects a shift from:
- Euphoria to fear
- Expansion to contraction
- Buying pressure to selling dominance
From a technical perspective, crashes represent strong bearish trends driven by breakdowns, momentum loss, and volume expansion.
Conclusion
Market crash analysis consistently reveals one key insight:
Price action provides early signals before major market movements.
By focusing on:
- Market structure
- Support and resistance
- Momentum indicators
- Volume behavior
traders can develop a structured understanding of how crashes unfold.
Technical analysis does not eliminate uncertainty, but it offers a framework for navigating market volatility with clarity and discipline.
Ultimately, success in trading is not about avoiding every market crash—it is about recognizing signals, managing risk, and adapting to changing market conditions.
Disclaimer
This content is for educational purposes only and does not constitute investment advice.


Post Comment