Why the Musk Reality Check Index Matters
Modern investors increasingly demand accountability metrics, especially when valuations are driven by future expectations rather than current earnings.
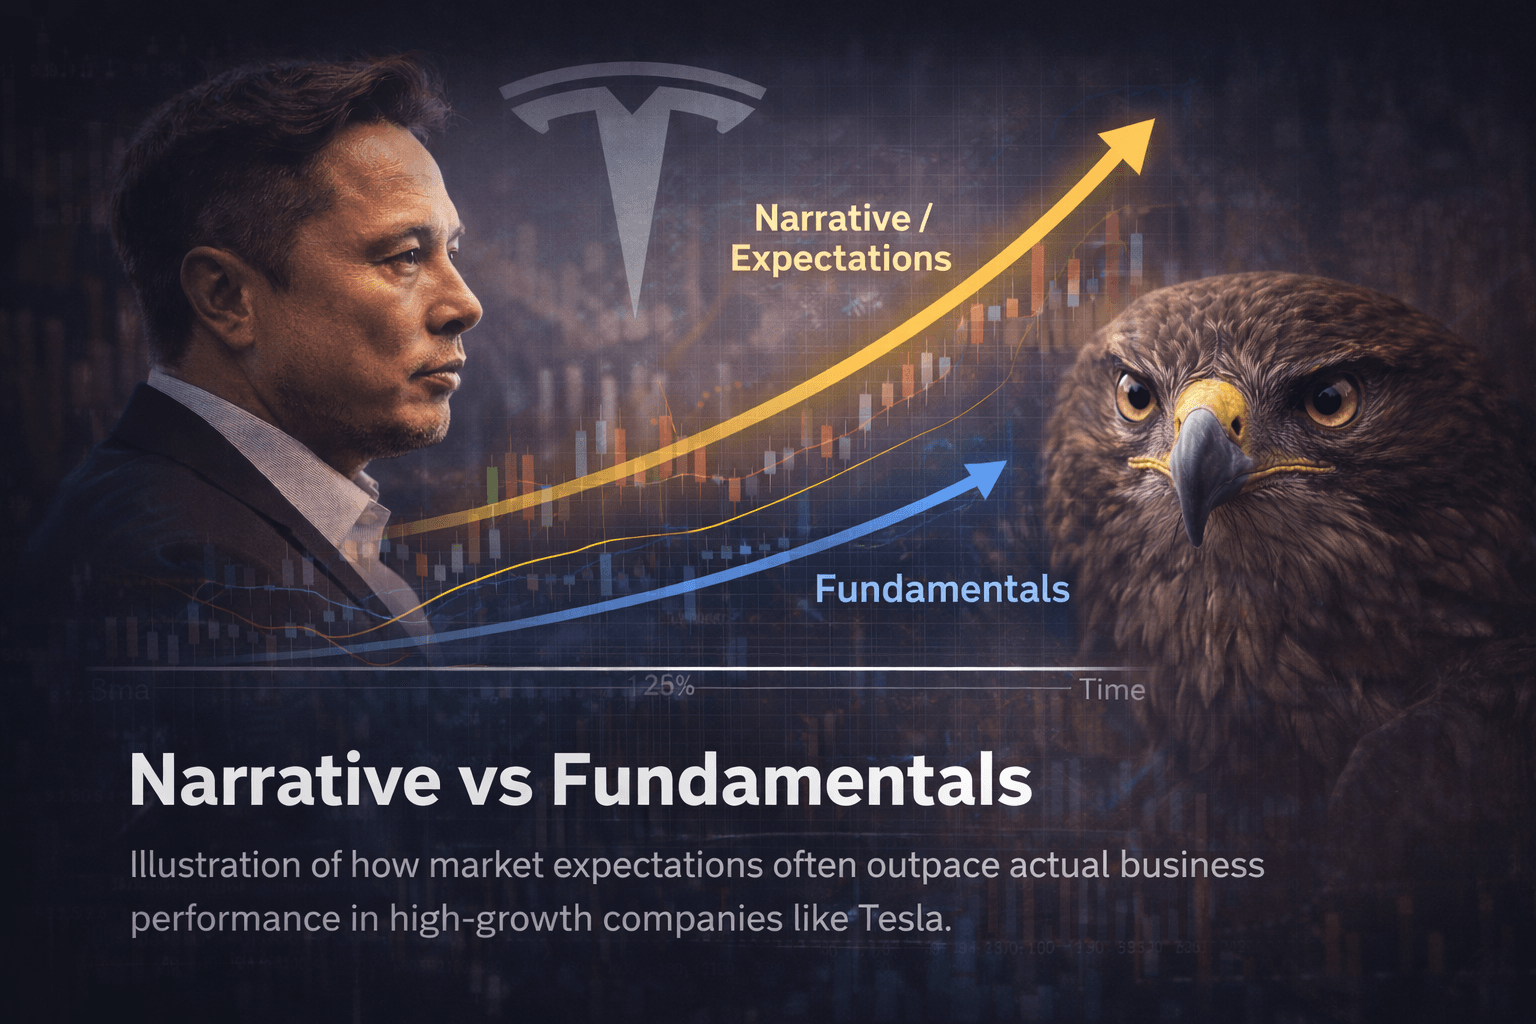
Lets start understanding Musk Reality Check Index from Tesla standpoint as Tesla represents a unique case:
- A large portion of its valuation is tied to future technologies like autonomy and robotics
- Investor sentiment often reacts more to announcements than deliveries
- Market narratives can significantly influence stock price behavior
This creates a measurable phenomenon:
Expectation → Delay → Narrative Shift → Stock Reaction
The Core Concept for mapping Musk Reality Check Index : Measuring Promise vs Delivery
The Musk Reality Check Index (MRCI) can be structured across three dimensions:
1. Timeline Accuracy
Tracking whether announced timelines are met.
Examples:
- Full Self-Driving promised repeatedly since 2016–2019
- Robotaxi fleet expected “next year” multiple times
- Roadster and Cybertruck timelines pushed repeatedly
Historical data shows that Musk has frequently revised timelines, with even internal acknowledgment that punctuality has been a challenge
2. Delivery Gap
Comparing projected vs actual rollout.
Example: Robotaxi rollout
- Promised: Fully autonomous, large-scale deployment
- Reality: Limited rollout with safety monitors and smaller fleets
Similarly, Full Self-Driving remains at Level 2 assistance, not full autonomy
3. Market Impact Correlation
Analyzing how announcements vs execution affect stock performance.
Recent observations:
- Robotaxi announcements → stock rallies
- Delays or under-delivery → stock corrections
Even recent developments show:
- Tesla stock remains under pressure despite progress in FSD rollout
Building the Musk Reality Check Index (MRCI)
To make this concept actionable, investors can track:
Metric 1: Promise Frequency
Number of major forward-looking statements per year
Metric 2: Delay Duration
Average delay between promise and delivery
Metric 3: Execution Score
Execution Score = (Delivered Milestones / Promised Milestones)
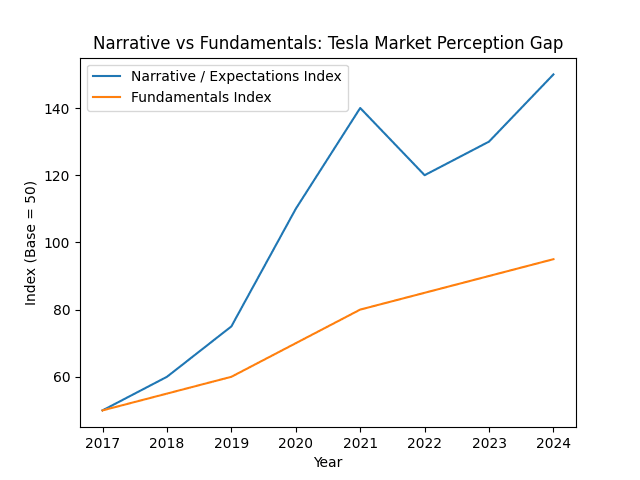
Metric 4: Sentiment Divergence
Difference between:
- Market optimism (news / announcements)
- Actual operational performance
Case Study: Full Self-Driving (FSD)
The most illustrative example of the Musk Reality Check Index is Tesla’s autonomous driving roadmap.
Promise Timeline
- 2016: Hardware ready for full autonomy
- 2019: 1 million robotaxis by 2020
- 2020–2024: Annual “next year” projections
Reality
- FSD still requires driver supervision
- Classified as Level 2 assistance
- Regulatory and technological barriers remain
Musk himself acknowledged:
“My predictions… have been optimistic”
Investor Insight
Despite delays:
Tesla maintains premium valuation
Narrative continues to support long-term optimism
This highlights a key insight:
Markets price potential, not just performance
Case Study: Robotaxi Vision
Promise
- Fully autonomous ride-hailing network
- Rapid scaling across cities
- Large fleet deployment
Reality
- Limited rollout in select locations
- Human safety monitors still required
- Smaller-than-promised fleet sizes
Market Reaction
- Announcements often trigger rallies
- Delays create volatility
Even today, analysts remain cautious about scaling expectations
Interactive Insight: The “Broken Promise Counter”
A powerful way to present this concept is through:
Broken Promise Counter
Tracks:
- Total promises made
- Total delayed
- Total delivered
Historical estimates suggest multiple missed projections across Tesla’s history, including production targets and autonomy timelines
Correlation: Overpromising vs Stock Performance
One of the most compelling aspects of the Musk Reality Check Index is the relationship between narrative and valuation.
Pattern Observed
- Bold announcement → Market excitement
- Media amplification → Increased investor inflow
- Delay or revision → Volatility
- New narrative → Cycle resets
Key Insight
Tesla’s valuation often reflects:
Future potential > Current execution
This is not unique—but Tesla is one of the clearest examples.
Global Perspective: Why This Matters Beyond Tesla
This framework is relevant for:
- Growth stocks driven by innovation narratives
- Founder-led companies with strong vision-driven leadership
- Markets where expectations dominate fundamentals
Investors in India, the US, and global markets increasingly face similar dynamics.
Common Misinterpretations
1. Assuming Delays Equal Failure
Not necessarily. Innovation cycles are inherently uncertain.
2. Ignoring Narrative Power
Markets often move on story before reality.
3. Over-relying on Promises
Forward-looking statements are not guarantees.
Strategic Insight: How Investors Should Use This Framework
The Musk Reality Check Index is not about predicting stock prices—it is about improving decision clarity.
Investors can use it to:
- Separate narrative from execution
- Evaluate risk more objectively
- Avoid overexposure to hype cycles
Internal Linking
Learn this article with:
Conclusion
The Musk Reality Check Index offers a structured way to analyze one of the most influential narratives in modern markets.
By tracking:
- Timeline accuracy
- Delivery gaps
- Market reactions
investors can move beyond speculation toward data-backed evaluation.
In a market where storytelling often drives valuation, clarity becomes a competitive advantage.
Frequently Asked Questions (FAQs)
1. What is the Musk Reality Check Index?
It is a framework to track the gap between Elon Musk’s promises and Tesla’s actual delivery timelines.
2. Why do Tesla’s delays not always impact its stock negatively?
Because markets often price future potential and narrative strength, not just current execution.
3. Can Musk Reality Check Index framework be applied to other companies?
Yes, especially to founder-led or high-growth companies driven by innovation narratives.
Final Note
If you want structured, research-driven insights that go beyond headlines and into real market behavior, consider subscribing for regular updates.
Premium Insight:
Markets reward vision—but they sustain value through execution.
Understanding the gap between the two is where informed investing begins.
Disclaimer:
This content is for educational purposes only and does not constitute investment advice.


Post Comment