Support and resistance strategy is one of the most fundamental concepts in technical analysis in trading. Despite the availability of complex indicators and automated systems, experienced traders continue to rely on these key price levels to make structured decisions.
Understanding how support and resistance work is not about drawing random lines on a chart—it is about identifying areas where market participants consistently react, creating opportunities for high-probability trades.
What is Support and Resistance Strategy in Trading?
Support and resistance represent price zones where the balance between buyers and sellers shifts.
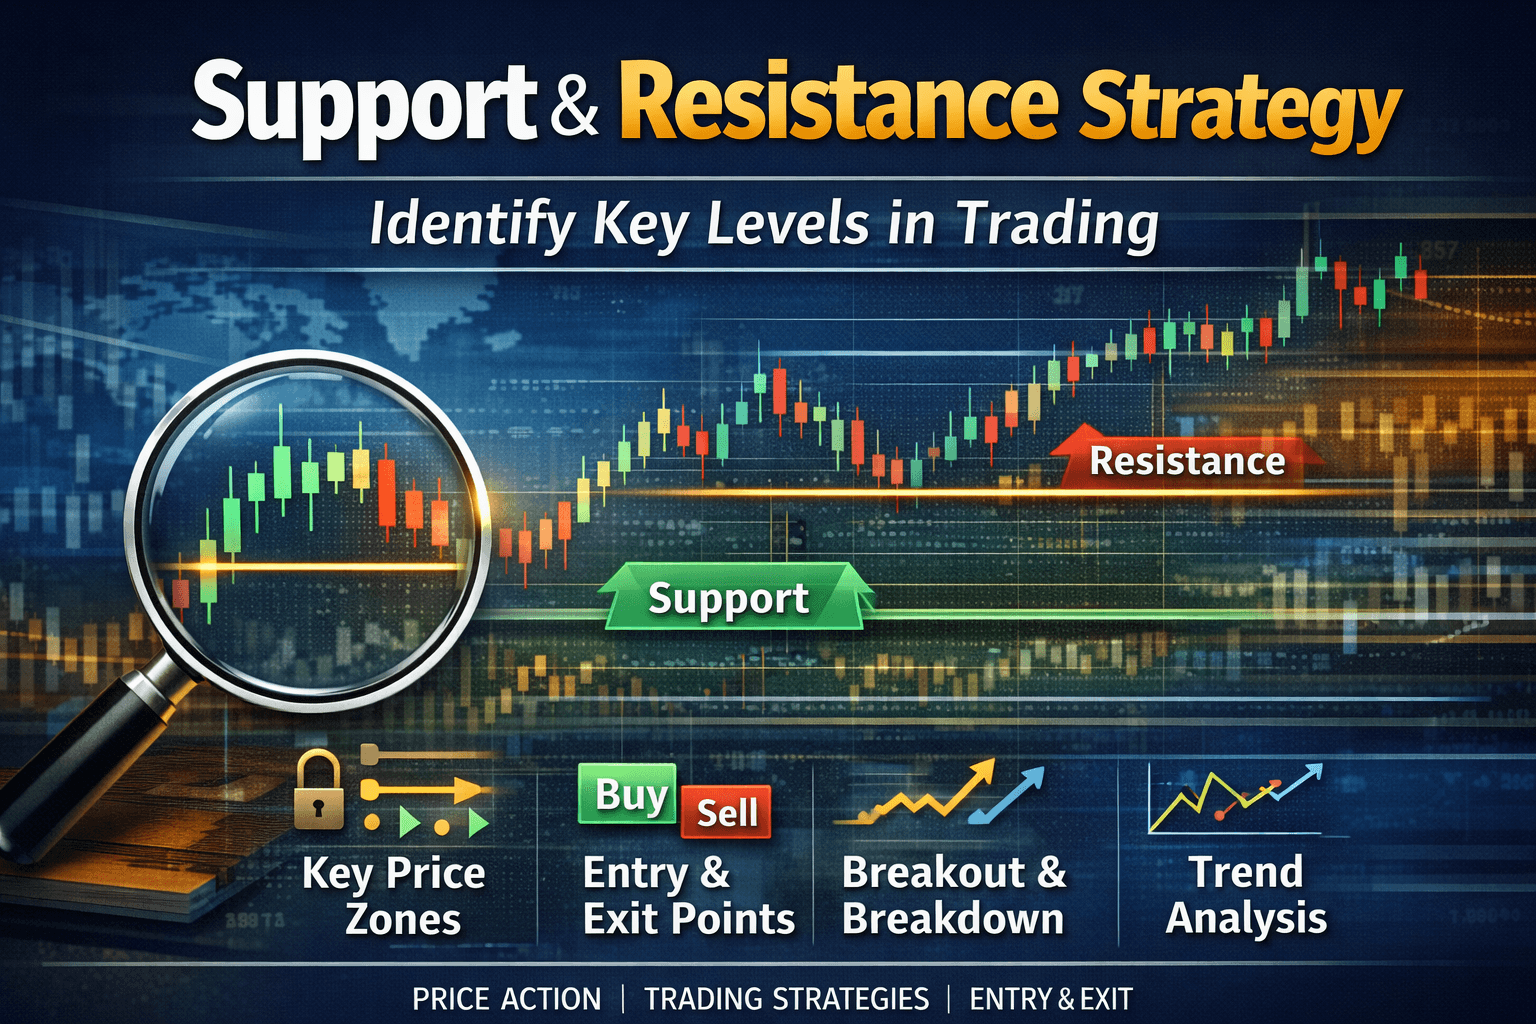
- Support is a level where demand increases and price tends to stop falling
- Resistance is a level where supply increases and price tends to stop rising
These levels are not exact points but zones of interest, formed by repeated interactions between market participants.
In simple terms, support acts as a floor, while resistance acts as a ceiling for price movement.
Benefits of Support and Resistance Strategy in Trading
In modern markets influenced by global liquidity, institutional activity, and algorithmic trading, price often reacts at historically significant levels.
A structured support and resistance strategy helps traders:
- Identify potential entry and exit points
- Manage risk effectively
- Understand market sentiment
- Avoid random decision-making
Rather than predicting price, it allows traders to respond to market behavior with clarity.
How Support and Resistance Strategy Works in Real Market Conditions
Support and resistance strategy levels emerge from repeated price interactions.
1. Historical Price Reactions
When price repeatedly reverses from a specific level, it becomes significant.
Example:
A stock bouncing multiple times from ₹500 establishes it as a support zone.
2. Psychological Price Levels
Round numbers such as:
often act as strong support or resistance due to collective market perception.
3. High Volume Zones
Areas where large volumes are traded tend to become key levels, as institutional activity leaves a footprint.
Types of Support and Resistance
1. Horizontal Levels
These are the most common and easiest to identify.
- Drawn across multiple highs or lows
- Represent clear buying or selling zones
2. Trendline Support and Resistance Strategy
In trending markets:
- Uptrend → trendline acts as support
- Downtrend → trendline acts as resistance
These dynamic levels evolve with price movement.
3. Moving Average Levels
Popular moving averages (50-day, 200-day) often act as dynamic support and resistance.
They are widely followed by institutional participants.
How to Identify Support and Resistance Strategy Correctly
A common mistake is overcomplicating the process.
Instead, follow a structured approach:
Step 1: Observe Price Structure
Look for areas where price has:
- Reversed multiple times
- Consolidated before a breakout
Step 2: Mark Zones, Not Lines
Support and resistance are zones, not exact prices.
Avoid drawing thin lines—use broader areas.
Step 3: Focus on Higher Timeframes
Levels from daily or weekly charts are more reliable than lower timeframes.
Step 4: Validate with Volume
Higher volume near a level increases its importance.
How Support and Resistance Strategy Works in Real Markets
Consider a scenario:
A stock approaches resistance at ₹1000 multiple times but fails to break it. Over time, buying pressure builds. When price finally breaks above this level with strong volume, it often leads to a sustained upward move.
This phenomenon is known as a breakout.
Similarly, when price breaks below support, it may lead to a breakdown.
Role of Support and Resistance in Trading Strategy
A well-defined support and resistance strategy helps in:
1. Entry Planning
Buy near support in an uptrend
Sell near resistance in a downtrend
2. Stop-Loss Placement
Place stop-loss slightly beyond support or resistance to manage risk.
3. Profit Target Setting
Use the next resistance or support level as a target.
Key Insight: Role Reversal
One of the most important concepts in Support and resistance strategy:
When support breaks, it often becomes resistance.
When resistance breaks, it often becomes support.
This is known as role reversal, and it reflects changing market sentiment.
Common Mistakes Traders Make in Support and Resistance Strategy
1. Drawing Too Many Levels
Too many lines in Support and resistance strategy create confusion rather than clarity.
2. Ignoring Market Trend
Support and resistance strategy should always be analyzed within the context of the trend.
3. Treating Levels as Exact Points
Markets rarely respect exact numbers—focus on zones in Support and resistance strategy.
4. Trading Without Confirmation
In Support and resistance strategy , entering trades without price confirmation increases risk.
Support and Resistance Strategy in Global Markets
Whether analyzing Indian equities or global indices like the S&P 500, support and resistance principles remain consistent.
This is because:
- Market behavior is driven by human psychology
- Institutional activity follows similar patterns globally
- Price action reflects supply and demand universally
This makes support and resistance strategy applicable across:
- Indian markets
- US markets
- Global asset classes
Strategic Insight: Simplicity Drives Consistency
Many traders search for complex strategies, but often overlook simple tools that work consistently.
Support and resistance strategy remains effective because it:
- Reflects real market behavior
- Aligns with institutional activity
- Provides clear decision zones
Clarity, not complexity, is what improves trading outcomes.
To Deepen inderstanding , learn connected Suggestions –
- Technical Analysis in Trading
- RSI Indicator Strategy
- Market Crash Analysis
Conclusion
Support and resistance strategy is not just a technical concept—it is a framework for understanding how markets behave.
By focusing on:
- Key price levels
- Market structure
- Confirmation signals
traders can move from random decisions to structured execution.
In a market driven by uncertainty, identifying where decisions are likely to happen provides a meaningful edge.
Frequently Asked Questions (FAQs)
1. How accurate are support and resistance levels?
They are not exact but act as zones where price reactions are likely.
2. Can support and resistance be used in all markets?
Yes, they apply across stocks, forex, commodities, and global indices.
3. What timeframe is best for identifying levels?
Higher timeframes like daily and weekly charts provide more reliable levels.
Final Note
If you want structured, research-driven insights on market behavior and trading strategies, consider subscribing for regular updates.
Disclaimer:
This content is for educational purposes only and does not constitute investment advice.


Post Comment