Introduction
Technical indicators in trading play a critical role in technical analysis and strategy execution in trading. While markets generate vast amounts of price data, the ability to interpret that data using structured tools is what separates random trading from disciplined decision-making.
Understanding technical indicators, price action, and risk management is essential for traders aiming to improve consistency. However, success does not come from using many indicators—it comes from using the right indicators with a clear strategy execution framework.
This guide explores the top 10 technical indicators in trading, their practical application, and how they support structured trading decisions across equities, forex, commodities, and crypto markets.
Why Technical Indicators Matter in Strategy Execution
As suggested above that Technical indicators in trading play a crucial role in helping traders analyze price movements and execute strategies effectively. Understanding how technical indicators in trading work allows traders to identify trends, confirm signals, and improve entry and exit decisions. Whether you are a beginner or an advanced trader, mastering technical indicators in trading can significantly improve consistency and reduce emotional decision-making.
Technical indicators are mathematical tools derived from price, volume, or volatility. Their purpose is to:
- Simplify complex market data
- Identify trends and momentum
- Support entry and exit decisions
- Improve risk-reward planning
Research and market observations suggest that traders who follow structured indicator-based strategies combined with discipline tend to achieve better long-term consistency compared to unstructured approaches.
However, indicators are not predictive tools—they are decision-support systems within the broader framework of technical analysis and strategy execution in trading.
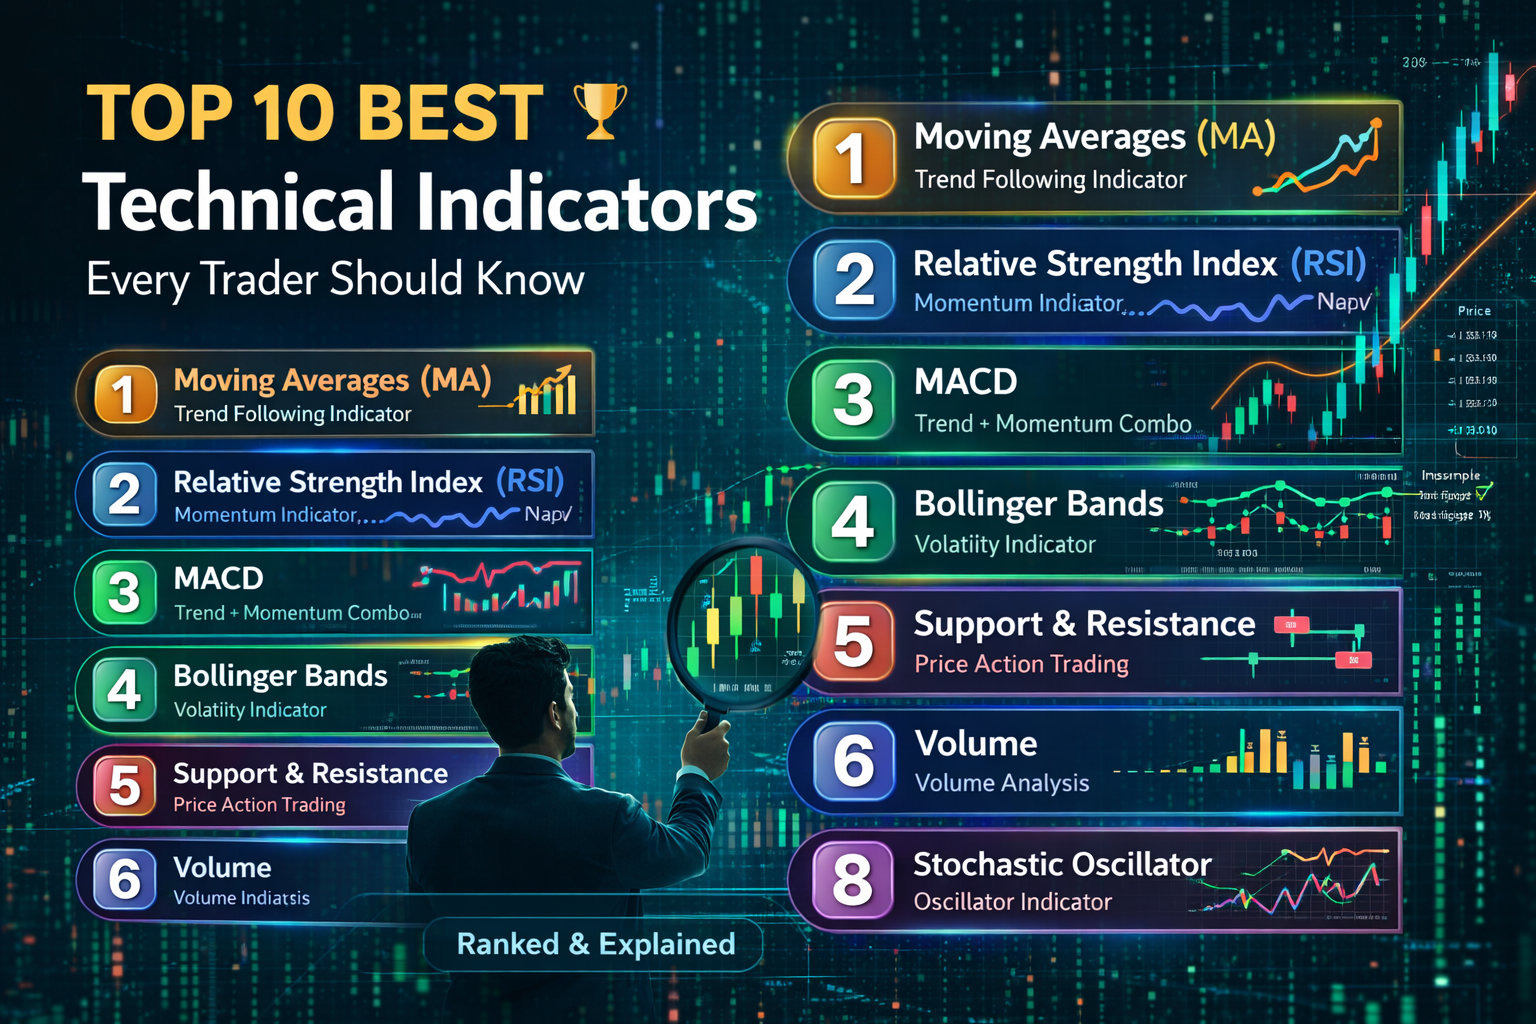
Top 10 Technical Indicators in Trading (Ranked by Practical Use)
Successful traders don’t rely on just one tool. They combine price action trading, support and resistance levels, and multiple momentum indicators like RSI and MACD crossover to build a strong entry and exit strategy. This approach improves accuracy and reduces false signals.
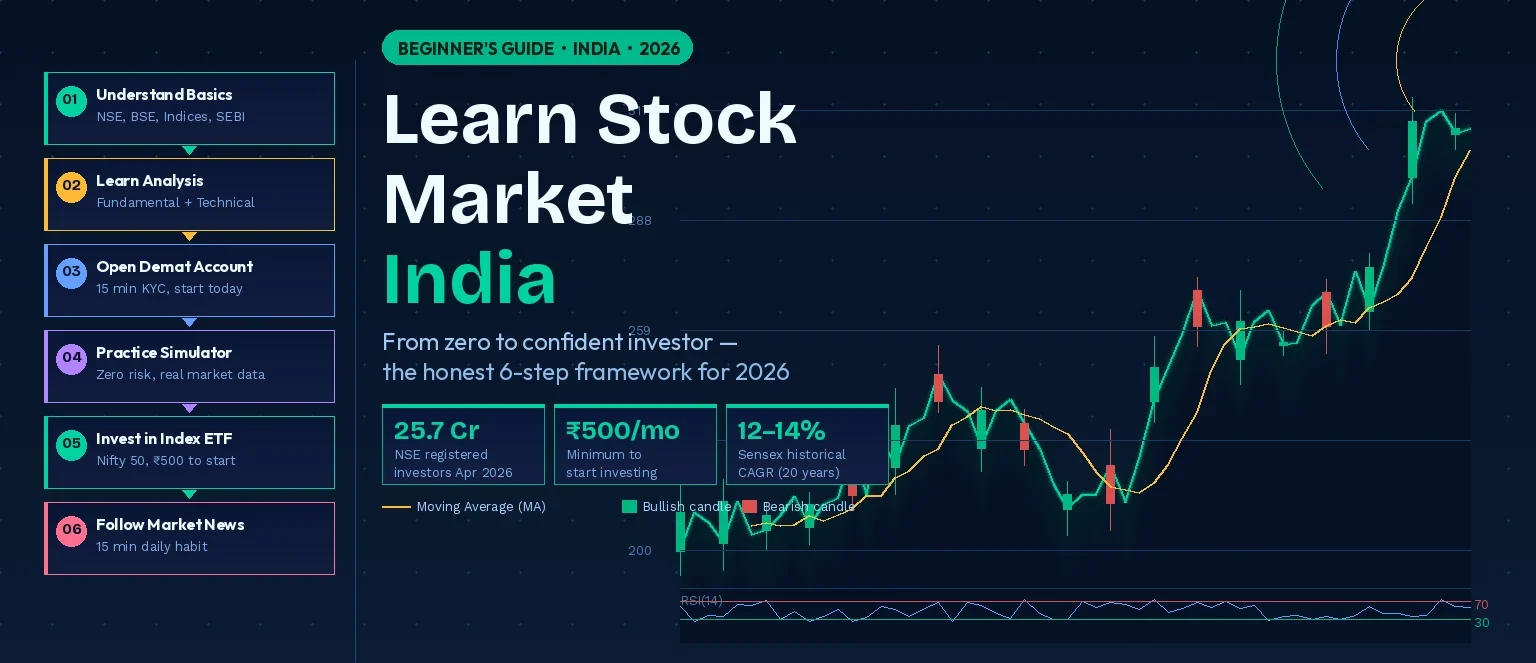
1. Moving Averages (MA): Foundation of Trend Analysis
Moving averages remain the most widely used indicator globally. They smooth price data to reveal the underlying trend.
- Types: Simple Moving Average (SMA), Exponential Moving Average (EMA)
- Application: Trend identification, dynamic support/resistance
- Strategy Use: Crossover systems such as Golden Cross and Death Cross
Data-driven trading approaches show that trend-following strategies using moving averages perform effectively in trending markets, making them essential for beginners and professionals alike.
2. Relative Strength Index (RSI): Momentum Indicator
The RSI measures the strength and speed of price movements on a scale of 0 to 100.
- Above 70 → Overbought
- Below 30 → Oversold
RSI is widely used to identify potential reversal zones and momentum exhaustion. Its simplicity makes it one of the most reliable indicators for combining with trend-based strategies.
3. MACD: Trend and Momentum Combination
The Moving Average Convergence Divergence (MACD) integrates trend and momentum into a single indicator.
- Components: MACD line, Signal line, Histogram
- Use cases: Trend confirmation, momentum shifts, entry timing
MACD is particularly effective in identifying early trend reversals and continuation patterns, making it a core tool in structured strategy execution.
4. Bollinger Bands: Volatility Analysis Tool
Bollinger Bands measure volatility using a moving average and standard deviation bands.
- Upper Band
- Middle Band (Moving Average)
- Lower Band
They help traders identify market expansion, contraction, and breakout opportunities. Studies show that volatility-based strategies can improve timing in high-movement environments.
5. Support and Resistance: Market Structure Core
Although not a traditional indicator, support and resistance remain one of the most powerful tools in technical analysis.
- Identify key buying and selling zones
- Used by institutional traders
- Applicable across all asset classes
These levels provide the foundation for trade planning, stop-loss placement, and target setting, making them essential for strategy execution.
6. Volume: Confirmation of Market Strength
Volume reflects the level of participation behind a price move.
- Rising price + high volume → Strong trend
- Rising price + low volume → Weak move
Volume analysis helps identify accumulation, distribution, and trend strength, making it a critical confirmation tool in trading decisions.
7. Fibonacci Retracement: Key Level Identification
Fibonacci retracement is used to identify potential pullback zones in trending markets.
Common levels include:
These levels are widely used in global markets to determine high-probability entry points during corrections.
8. Stochastic Oscillator: Short-Term Momentum Tool
The stochastic oscillator measures momentum relative to recent price ranges.
- Above 80 → Overbought
- Below 20 → Oversold
It is particularly useful in range-bound markets and short-term trading strategies, offering faster signals than RSI.
9. Average True Range (ATR): Volatility and Risk Measurement
ATR measures market volatility rather than direction.
- High ATR → High volatility
- Low ATR → Stable conditions
ATR is widely used for stop-loss placement and position sizing, making it essential for risk management.
10. VWAP: Institutional Benchmark Indicator
The Volume Weighted Average Price (VWAP) represents the average price weighted by volume.
- Used primarily in intraday trading
- Helps identify fair value
Institutional traders rely on VWAP to assess entry efficiency and market positioning, making it a powerful tool for precision trading.
How to Use Technical Indicators Effectively
Using technical indicators effectively is not about quantity—it is about clarity and combination.
Best practices include:
- Limiting to 2–3 indicators per strategy
- Combining different types (trend + momentum + volume)
- Aligning indicators with market context
Effective Indicator Combinations
- Moving Average + RSI → Trend + Momentum
- Support/Resistance + Volume → Structure + Confirmation
- Bollinger Bands + RSI → Volatility + Reversal
This structured approach enhances technical analysis and strategy execution in trading, improving decision quality.
Common Mistakes in Using Indicators
Even the best indicators fail when used incorrectly.
1. Indicator Overload
Using too many indicators creates confusion and conflicting signals.
2. Blind Dependence
Indicators should support analysis, not replace judgment.
3. Ignoring Market Context
Indicators perform best when aligned with trend and structure.
Behavioral finance research highlights that over-reliance on indicators without context often leads to inconsistent outcomes.
Consistency and Discipline in Strategy Execution
The effectiveness of technical indicators depends on how consistently they are applied.
Key principles include:
- Following predefined rules
- Maintaining risk-reward discipline
- Avoiding emotional decisions
A structured approach combining technical analysis and strategy execution in trading allows traders to:
- Improve entry and exit timing
- Manage risk efficiently
- Build long-term consistency
Conclusion
Mastering technical indicators in trading is essential for consistent success in financial markets. By combining multiple technical indicators in trading with proper risk management, traders can improve strategy execution and make more informed decisions.
Technical indicators are not shortcuts to success—they are tools that support structured thinking and disciplined execution.
When integrated into a well-defined strategy, they help traders move from:
- Confusion to clarity
- Random decisions to structured execution
- Emotional reactions to data-driven actions
Ultimately, the real edge in trading lies not in the number of indicators used, but in the consistent application of technical analysis and strategy execution in trading.
Disclaimer
This content is for educational purposes only and does not constitute investment advice.


Post Comment